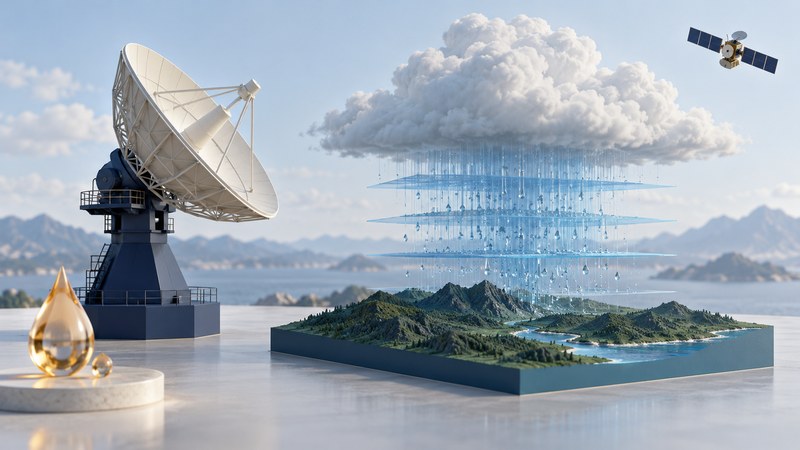
NASA's NPOL research radar helps scientists investigate the precipitation inside storms. Its observations support estimates of rain and snow properties and help researchers evaluate the assumptions used to turn satellite measurements into rainfall information.
NPOL is a scanning, dual-polarimetric S-band radar. “Scanning” describes sampling different directions and elevations; “dual-polarimetric” means comparing information from horizontal and vertical polarizations. The useful result is a set of measurements that can be interpreted together.
What the measurements mean
Precipitation radar observes volumes of air containing many particles. Echo properties depend on that mixture, its movement and the path between it and the instrument. A radar-derived rain rate therefore involves physical assumptions and processing as well as an instrument measurement.
| Variable | Useful interpretation | Question to ask |
|---|---|---|
| Reflectivity, often shown in dBZ | Strength of the returned signal expressed as an equivalent reflectivity. | Could particle size, phase or a mixture affect the return? |
| Doppler radial velocity | Motion toward or away from the radar along the viewing direction. | What direction is the radar looking? |
| Differential reflectivity, ZDR | Comparison of horizontal and vertical reflectivity; sensitive to particle shape and orientation. | What other observations support the proposed particle type? |
| Correlation coefficient, CC or ρhv | Similarity of the horizontal and vertical returns. | Does a mixed population or non-weather return require investigation? |
| Specific differential phase, KDP | Change with distance in the phase difference between polarizations. | Which processing and precipitation conditions apply? |
The National Weather Service's dual-polarization product guide explains the polarization variables and distinguishes base products from derived precipitation and classification products. Those principles help when reading NPOL research, although a research instrument and an operational weather-radar display can use different processing and product definitions.
A classification map is the output of an algorithm combining evidence. Treat its colors as categories defined by the legend and method, with uncertainty to investigate. A rain-rate map and a reflectivity map answer different questions even when they use similar colors.
Interpret a strong return in context
The NWS examples of dual-polarization applications show how melting-layer features can appear in several products. Use them to learn the reasoning; apply the definitions and validation in the particular study you are reading.
Why ground observations matter to satellite estimates
Satellites cover broad areas, while ground instruments provide complementary observations of precipitation structure and what reaches the surface. NASA's GPM ground-instrument overview describes NPOL alongside rain gauges, disdrometers and other radars. A disdrometer measures properties of falling particles, helping connect radar signals to the precipitation itself.
These instruments sample differently. A rain gauge represents a small location and accumulation period; a radar samples an atmospheric volume; a satellite product describes its own footprint and time interval. A useful comparison first aligns the locations, times and quantities being compared.
This is why ground validation is more than checking whether two pictures look alike. The research asks how measurement differences and physical assumptions affect the result, and where an estimate performs well enough for its intended use.
Place NPOL's hardware in its historical period
NASA's instrument overview, dated June 27, 2011, records a complete NPOL antenna-system upgrade in 2010. Descriptions of its earlier flat-panel configuration belong to that earlier period. The enduring subject is its role in precipitation research, while antenna and processor descriptions should be attached to a dated configuration.
The Wallops radar-assets page describes NPOL upgrades and its role connecting satellite observations with precipitation near the ground. Its prose and specification table use different processor labels, so use the technical documentation for a particular campaign when a precise hardware version matters. Avoid carrying a historical “one of only two” claim forward as a current inventory of research radars.
Read a research figure in a repeatable order
- Identify the quantity. Read the product name, units and color scale. Note whether the image is reflectivity, velocity, estimated rate, accumulation or classification.
- Locate the observation. Check time, radar position, scan elevation or cross-section, and distance. A low-elevation scan still samples different heights as distance increases.
- Read the method. Find calibration, filtering, retrieval assumptions and quality flags. Check whether missing data have a separate symbol.
- Find the comparison. Identify gauges, disdrometers or another instrument, then check their sampling periods and areas.
- State the supported conclusion. Summarize the particular event or dataset and its limits before generalizing to other seasons or regions.
Start with NASA's GPM ground-validation overview to connect individual instruments with the wider research program. For immediate weather decisions, use your local official weather service and its current warnings; research figures are intended for scientific interpretation.