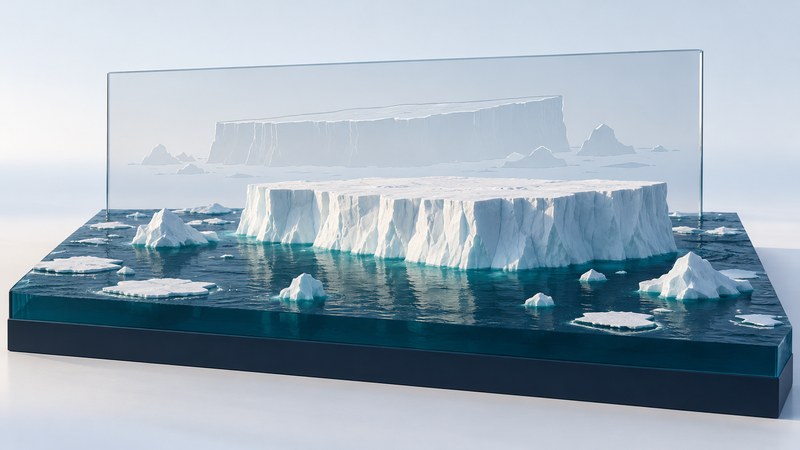
An iceberg picture becomes useful evidence when you know when and where it was taken, which piece of ice it shows, and how the image was made. The B-15 iceberg and its fragments provide a well-documented example of how a striking photograph can become a record of calving, drift, breakup, and environmental change.
Identify what is floating
An iceberg is a floating piece that has broken away from a glacier or ice shelf. NOAA’s iceberg guide distinguishes flat-topped, steep-sided tabular bergs from other shapes. Sea ice forms from freezing seawater; an ice shelf is a floating extension of land ice that remains attached to the coast. A satellite scene can contain all three.
Start with edges and context. A large angular outline may help identify a tabular iceberg, while surrounding sea ice may appear as many floes or a more continuous cover. Clouds can also look white. Confirm interpretation with the image provider’s caption and product information, then follow the same feature across a sequence.
A view from above shows the visible outline. Estimating ice volume requires information about thickness as well as area. Cropping and zooming change apparent size on the screen; use the scale bar, mapped coordinates, or a documented pixel size before measuring.
B-15: keep each fragment and date together
B-15 calved from Antarctica’s Ross Ice Shelf in March 2000 and later divided into named fragments. NASA’s B-15J account follows one fragment into warmer water in 2011. Its Aqua/MODIS image was acquired on December 19, 2011, and the article was published on December 29. Those dates describe different events.

In the 2011 NASA scene, some bright shapes are iceberg fragments and others are clouds. NASA specifically identifies clouds in the northeast of the image. This is a useful exercise in checking a visual interpretation against documented information instead of classifying every white shape as ice.
Record the complete fragment name. B-15, B-15A, and B-15J belong to the same breakup history but represent different objects or stages. A comparison needs a defensible identity match, especially after rotation, fragmentation, or a long gap between observations.
Make a comparison another reader can check
| Detail | Why it matters | Useful action |
|---|---|---|
| Acquisition date and time | Establishes the interval between observations | Separate it from upload or publication date |
| Location and fragment label | Connects the picture with a particular object | Check coordinates, caption, and identity through the sequence |
| Sensor and processing | Changes how clouds, water, and ice appear | Identify natural color, false color, radar, or another product |
| Scale and projection | Controls distance and area interpretation | Use compatible mapped measurements |
| Visibility | Clouds or the image edge may hide fragments | Mark obscured areas separately from open water |
For a fictional example, suppose a verified fragment center shifts 30 km between observations six days apart. Its net displacement divided by elapsed time is 5 km per day. That describes the average rate of displacement between those observations; the actual path may be longer or curved. A rotated outline also needs careful alignment before you interpret a changed bounding box as a change in area.
Write observations before explanations: “Three separated pieces are visible on date B” is a visual observation. “The iceberg lost half its mass” needs thickness information and measurements of the relevant pieces. Use the image-comparison notes template to keep identity, measurements, and uncertainties together.
What the Ross Sea study established
In their 2002 study of B-15’s ecological impact, Kevin Arrigo and colleagues linked restricted pack-ice movement with reduced open water and a shorter phytoplankton growing season in the southwestern Ross Sea. Their analysis reported primary productivity more than 40 percent below normal in the studied region. This is a result about a specified place, period, and productivity estimate.
The study combined satellite information about sea ice and ocean color with a productivity calculation. The iceberg photograph supplies geographic context; the ecological finding comes from that wider analysis. Keep this distinction when using the image in a lesson or presentation: cite the research for the biological effect and the image record for the appearance of the ice.
For a new iceberg event, ask which observations measure ice movement, open water, and biological response during that event. The historical B-15 result is a case to investigate, rather than a fixed percentage to apply to other icebergs.
Related reading
- Earth imagery comparison: Build a fair comparison between two dated ice observations.
- The One World Expedition: Follow the difference between travel over sea ice and progress toward a destination.
- Shackleton’s Endurance expedition: Compare ice drift, dated positions, and documentary photographs.