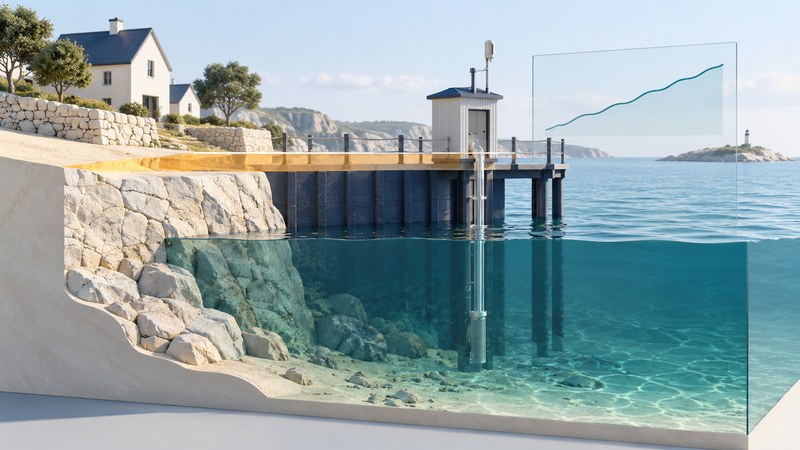
Sea-level rise has a global component and a local expression. To understand a coastline, read water-level change relative to the land, identify the observation period, and distinguish the historical trend from a projection of future conditions.
A tide-station record is a useful starting point for learning about coastal change. It becomes more informative when you retain its units, reference, uncertainty, and geographic context instead of quoting a single rate.
Follow both the water and the land
Warming seawater expands, and melting land ice adds water to the ocean. These are major contributors to global rise, as explained in NASA’s sea-level explanation. Regional ocean conditions and vertical land motion help determine what a particular shore experiences.
A tide gauge measures water height relative to a local reference on land. If that land sinks, relative sea level can rise faster; uplift can reduce or reverse the local relative trend. Satellite measurements provide a broader view of ocean-surface change. The two observing systems answer related questions with different spatial coverage and references.
Maine and Nova Scotia are useful places to ask how an ocean signal and postglacial land movement combine. Compare specific records and geological evidence instead of assigning one rate to the whole region. Nearby shores can differ, and a long geological reconstruction has a different resolution and uncertainty from an instrument record.
Read a tide-station record in context
Start at NOAA’s Sea Level Trends and Extremes, available as a beta product when checked in October 2026. It presents historical relative sea-level and extreme-water-level information at U.S. tide gauges. Its Station View includes Observed Sea Levels, Extremes, and Variability; Regional View helps examine regional context and land motion.
- Launch the product and choose a station near the coast you want to understand. Record its name and identifier; proximity alone does not make it representative of every nearby inlet.
- Start with observed sea levels. Record the beginning and end of the data period, the rate units, and the reported confidence interval.
- Read the axis and reference labels. Establish whether a graph shows water levels, departures from a reference, a seasonal adjustment, or a fitted trend.
- Look for gaps and shorter fluctuations. Use the variability information to understand how monthly or seasonal changes sit around the longer pattern.
- Read the station and product notes before comparing it with another record. Match periods and definitions where possible.
NOAA’s explanation of sea-level trends describes why relative and global trends differ and why the length of the record matters. A few unusually high or low years can influence a short fit strongly. A published confidence interval belongs with the estimate.
| Field | Question to answer |
|---|---|
| Station | Which location and identifier? |
| Period | Which start and end years, with what gaps? |
| Quantity | Relative water level, global average, or another measure? |
| Units and reference | Millimeters per year, meters, or another unit; relative to what? |
| Uncertainty | What interval and confidence level are reported? |
| Method and version | Which fit, data release, and retrieval date? |
Check the units before interpreting the size
A rate and a water-level elevation have different units. To relate a future water level to land elevation, both need compatible vertical references and an appropriate scenario. Adding a number from one graph to a property elevation from an unrelated map can produce a precise-looking but invalid result.
A confidence interval around a fitted historical rate describes uncertainty in that estimate under its method. Future projections involve additional assumptions and uncertainties. Keep their labels separate in notes and charts.
Use the right product for the future question
NOAA explicitly describes Trends and Extremes as historical information and directs users to its Sea Level Calculator for forward-looking scenarios. Follow that link from the product’s current guidance when your question concerns a future year.
For exploring coastal inundation, the NOAA Sea Level Rise Viewer provides water-depth, connectivity, and mapping-confidence information. Read the selected scenario, reference level, geographic coverage, and limitations before interpreting a colored area. The visible boundary depends on the underlying elevation and water-level information.
Use these tools to frame questions for local planning and engineering, with the applicable local requirements and site evidence. A broad visualization cannot establish the flood exposure of a particular building by itself. Storms, tides, waves, drainage, and protective infrastructure need their own treatment.
Separate three statements in a report: what the gauge observed, what a model projects under a stated scenario, and what a local impact assessment concludes. This makes the reasoning traceable and helps readers see which assumptions change the answer.
Keep a record you can update
Save the station or product link, retrieval date, period, rate, uncertainty, units, reference, and notes about land motion. For scenarios, add the baseline year, future year, scenario name, and version. Save a short plain-language interpretation alongside the numbers.
A useful observation note reads: “At this station, over this period, relative sea level changed at the reported rate, with this uncertainty.” A useful next question might be whether a shorter recent interval differs, whether land motion is documented, or how a chosen future scenario changes the local water-level range.
Download the station-reading and scenario worksheet, including the fictional units exercise and fields for keeping observations separate from projections.
Related reading
- Gravity-derived mass maps: Compare local water-level records with broad changes in water and ice mass.
- Isla Calafia: See how sea level and land motion enter a past-shoreline reconstruction.
- Gulf of Mexico: Place coastal observations within a basin, its currents, and river inputs.