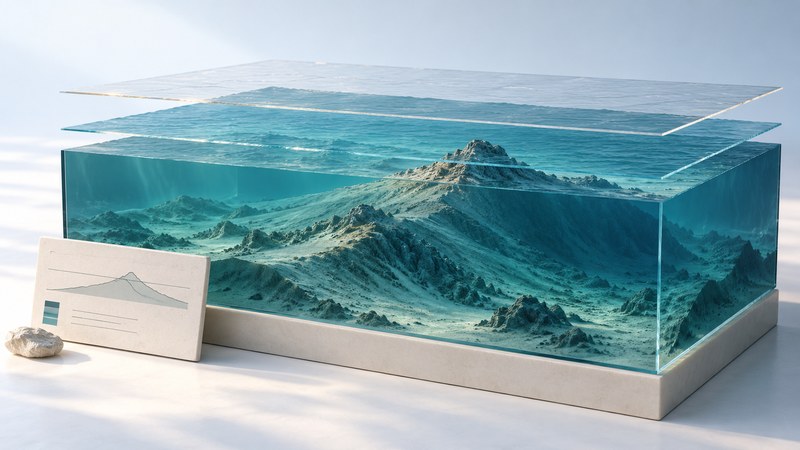
Isla Calafia is the name given to a proposed former island beneath the Santa Barbara Channel. Its interest lies in how geologists reconstruct a vanished shoreline: they combine the shape of the seabed with evidence about past sea level and movement of the land.
Read the case in three stages: locate the underwater ridge, identify the measurements, and examine the assumptions used to infer an island. This gives you a way to evaluate a “lost island” claim without treating an attractive reconstruction as a direct observation.
A summit beneath the channel
The Santa Barbara Channel lies between the California mainland and the northern Channel Islands. The University of California, Santa Barbara’s 2001 announcement introduced Edward Keller’s interpretation of a submerged landform and the name Isla Calafia. For the developed argument, turn to the later research rather than using the announcement’s dimensions as a reconstructed coastline.
In their 2007 study of the Mid-Channel Anticline, Keller and colleagues proposed that part of the ridge’s summit was exposed around 20,000 years ago. They used seabed mapping and estimates of sea-level change, uplift and subsidence. Their mapped summit is about 105 meters below present sea level. The proposed island occupies a small summit area, not the whole long ridge.
Keep measurements and interpretations distinct
NOAA explains bathymetry as the depths and shapes of underwater terrain. A depth contour joins places at the same depth. Shaded relief makes slopes easier to see, while a profile shows a slice through the terrain. Each view answers a different question.
| Layer | Reader’s question | Useful check |
|---|---|---|
| Measured surface | What shape and depth were mapped? | Find units, contour interval and survey coverage. |
| Process interpretation | What could have produced that shape? | Compare competing explanations and supporting observations. |
| Past shoreline | Where did land meet water at a specified time? | Inspect both sea-level and land-motion assumptions. |
The Calafia paper interprets some summit features as possible erosion above water. It also describes depressions and mounds associated with hydrocarbon emissions. These multiple processes make the reasoning more informative than simply calling every irregularity an ancient shore.
A simple reconstruction you can check
Write down a reference surface and a time before calculating. Keep rates, such as meters per thousand years, separate from total movement in meters. A positive reconstructed height describes emergence under the chosen assumptions; evaluating the assumptions is the next step.
Read the published figures in sequence
In the linked paper, Figure 8 on printed page 283 maps the summit with one-meter contours and marks possible channels. Table 2 on that page varies uplift and subsidence. Figure 9 on page 284 presents the proposed regional shoreline. Compare the conditional calculation with the reconstruction it supports.
- Mark the area and time represented by each figure.
- Separate solid mapped features from inferred boundaries and pathways.
- Record one assumption that changes the result.
- Write a conclusion that retains the authors’ level of certainty.
A useful conclusion identifies a hypothesis supported by a combination of observations and modeling. A future resurfacing date or a present hazard forecast would require additional evidence and a different analysis.
Related reading
- Reading 3D maps: Check relief, elevation sources, and vertical exaggeration in a terrain view.
- Sea level and land motion: Distinguish water-level change from movement of the land reference.
- Gulf of Mexico: Read seafloor shape alongside circulation and coastal processes.