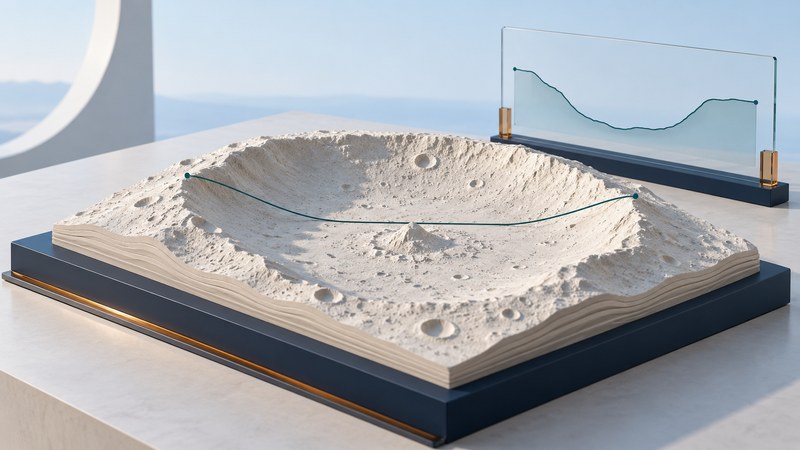
A lunar photograph shows how a surface reflects light under one illumination geometry. A terrain map describes the shape of that surface. Reading the two together lets you distinguish a high rim from a bright patch, estimate relief across a crater and understand why a polar hollow can remain shadowed. Begin with a named feature, a map legend and the dataset behind the display.
How a laser measurement becomes a terrain map
The Lunar Orbiter Laser Altimeter, or LOLA, aboard Lunar Reconnaissance Orbiter measures the round-trip travel time of laser pulses. With the spacecraft's position known, those ranges locate points on the lunar surface. LOLA splits each outgoing pulse into five beams, sampling several nearby spots. NASA's instrument description distinguishes range, pulse spreading and returned energy: they inform topography, roughness and reflectance, respectively.
A digital elevation model combines measurements into a grid. A grid cell is a representation of terrain at a specified scale; zooming in enlarges that representation. The measurement footprint, distance between tracks, interpolation and orbit solution all affect what detail the map supports. A camera-derived stereo terrain model has a different measurement chain, even when its display looks similar.
The PDS guide to LOLA products separates individual calibrated tracks (RDRs) from gridded maps (GDRs). For a first exploration, use a browser map or browse image. For calculations, retain the product label and its units, scaling and reference surface.
Read one crater in four passes
- Locate and record it. Open LROC QuickMap, find a named crater such as Tycho, and record its displayed coordinates. Note whether longitude runs from 0 to 360 degrees or uses east and west values. Keep the map's convention with the number.
- Inspect the image. Identify the rim, floor, central features and surrounding terrain. Look at the illumination direction. A long shadow can emphasize relief, while a high Sun can make the same feature look flatter.
- Compare an elevation layer. Read its color scale and units before interpreting a color. Switch between imagery and terrain while keeping the same location and extent. A red region means whatever that particular legend assigns to red.
- Record a profile or elevations. Where the selected product supports a terrain profile, draw a line across both rims and the floor. Otherwise record supported point elevations. Save the product name, endpoints, distance units and a link to the view so another reader can repeat the comparison.
QuickMap's official examples demonstrate changing illumination, comparing terrain models and inspecting slopes. If a layer is unavailable, use the examples to choose another supported terrain product rather than inferring height from image brightness.
Keep four map quantities separate
| Quantity | Meaning | Check before comparing |
|---|---|---|
| Elevation | Height relative to a stated reference surface. | Reference radius or datum and meters versus kilometers. |
| Local relief | Difference in elevation between selected places. | Which rim and floor, and whether both use the same dataset. |
| Slope | Rate of elevation change over horizontal distance. | Degrees versus percent and the measurement baseline. |
| Shaded relief | A rendered appearance under an assumed light direction. | Lighting settings and any vertical exaggeration. |
Lunar terrain has no sea level. Some products encode radial distance from the Moon's center; others display departures from a reference sphere. The LOLA product label governs conversion. Applying an offset twice, or treating a stored integer as meters, can produce a plausible-looking but wrong result.
Worked example: relief and average slope
A profile plot can exaggerate height if its horizontal and vertical axes use different scales. Read the numbers before judging the slope by eye. Repeating a profile on a finer grid can reveal more detail, but confidence still depends on the underlying measurements.
Use terrain to ask better polar questions
One dark image establishes shadow at that observation time. A claim of permanent shadow requires illumination over the relevant range of solar directions, together with terrain geometry. Temperature and compositional measurements answer additional questions about ice. The Moon-water guide explains that evidence chain.
Keep a short record of the feature, product, coordinate convention, scale, selected endpoints and uncertainty. The lunar terrain reading note includes the fictional calculation above and blank fields for your own map comparison. It is designed for an educational reading exercise.