
Rocks are physical records of processes inside Earth. Their minerals, textures and isotope ratios can preserve clues to formation and later change. To understand the deepest interior, scientists combine those records with earthquake waves, experiments and measurements of the planet as a whole.
The useful question is: what was measured, and which interpretation does it support? A surface sample, a seismic observation and a model of core material each contribute different evidence. Keeping them distinct makes deep-Earth research easier to read.
Earth has a rocky exterior and a metallic core
The crust and mantle are predominantly rocky; the core is predominantly metallic. The outer core is liquid and the inner core solid. The mantle is largely solid rock that can deform and flow over geological time, with partial melting in some settings. The USGS overview of Earth's interior connects these layers with the rigid outer plates.
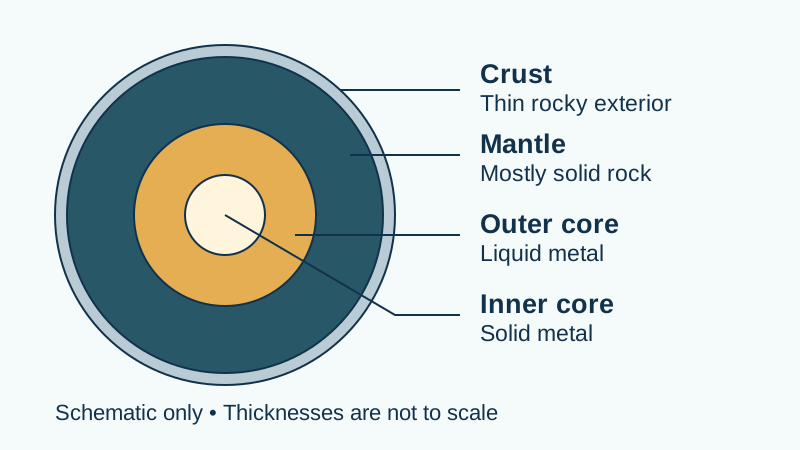
The crust is a very thin part of the planet. Beneath it, the mantle extends to the core–mantle boundary at roughly 2,900 km depth. The lithosphere combines the crust with the rigid uppermost mantle; these are the plates involved in plate tectonics. A mantle-derived rock therefore comes from a different reservoir than the metallic core.
Match each observation to the question it can answer
On a small screen, scroll the table sideways. Keyboard users can focus it and use the arrow keys.
| Evidence | What it helps establish | What still needs interpretation |
|---|---|---|
| Surface rocks and mineral samples | Composition, texture, and records of pressure, temperature or chemical change. | Original depth, later alteration, and how representative a sample is. |
| Seismic waves | Boundaries and variations in the way Earth transmits elastic waves. | How temperature, composition and physical state combine to produce a measured speed. |
| Laboratory experiments | How candidate materials behave at high pressure and temperature. | How experimental conditions and timescales compare with Earth. |
| Isotope measurements | Chemical histories, mixing and possible source reservoirs. | Whether competing sources or processes can produce similar signatures. |
| Gravity, density and magnetic observations | Constraints on the bulk planet and its internal behavior. | Which internal models satisfy the different observations together. |
The USGS introduction to the interior explains how these approaches complement one another. It is an older publication: its general evidence framework remains useful, while precise compositional estimates and research status should be followed through newer work.
A strong interpretation fits more than one kind of observation. A laboratory result can show that a proposed material is physically plausible, while seismic and chemical evidence test whether that material belongs in a particular part of Earth.
Why earthquake waves reveal a liquid outer core
Earthquakes send different kinds of waves through the planet. P waves are compressional waves that travel through solids and liquids. S waves are shear waves that travel through solids and cannot propagate through a liquid as shear waves. Their different paths and arrival patterns help reveal the outer core's liquid state. The USGS P- and S-wave diagram illustrates this distinction.
Wave paths bend as material properties change, and boundaries can reflect waves or convert one type into another. Scientists compare many recorded arrivals with predicted travel times. A missing arrival at one station is only one observation; the useful evidence is the consistent pattern across earthquakes and receivers.
Reading a seismic image therefore involves a model. A region described as “slow” transmits a particular wave more slowly than a reference model predicts. To translate that into a statement about temperature or composition, researchers need additional constraints.
What an isotope fingerprint means
Isotopes are forms of the same element with different neutron counts. Some isotope systems change through radioactive decay; others preserve differences inherited from their source materials. A measured ratio can help compare reservoirs, but its interpretation depends on the element, the processes that separate it, and the history of the sample.
It helps to read the chain in three steps:
- Measurement: which isotope ratio differs from a reference, and by how much compared with its uncertainty?
- Process: what could produce or preserve that difference—decay, melting, mixing or a distinct source?
- Geological model: where could that source have been, and how could its chemical signature reach the sampled rock?
These steps are related, but they have different evidence requirements. An instrument measures the sample presented to it; the route from a deep reservoir to that sample must be reconstructed.
A dated example: the osmium study of April 19, 2002
In their 2002 Science paper, Anders Meibom and Robert Frei studied osmium-rich alloy grains associated with peridotite-bearing ophiolites in the Klamath Mountains. They reported unusually radiogenic osmium isotope ratios and interpreted them as evidence of an ancient chemical reservoir.
The paper explored whether this signal could involve the outer core. Its reasoning was conditional: if the isotope signature came from the outer core, a model of inner-core growth would have to account for it. Alternative mantle reservoirs also required investigation. The observation was a chemical signature in accessible grains; the core connection was a proposed history.
Later work asks more specific questions
An October 2002 study of more than 700 osmium-rich alloys examined chemical heterogeneity and equilibration in the upper mantle. It illustrates why the distribution of results across many grains matters when interpreting a few unusual samples.
More directly, Meibom, Frei and Sleep's 2004 follow-up reported additional measurements and favored upper-mantle processes for these osmium-rich alloys. They found a core origin difficult to reconcile with the implied timing of inner-core growth. The historical osmium proposal should therefore be read alongside the later work that challenged its source interpretation.
Research also uses other isotope systems. In a study published May 21, 2025, Nils Messling and colleagues reported ruthenium isotope anomalies in Hawaiian basalts and combined them with tungsten evidence. They interpreted the paired signals as evidence for a core contribution to the mantle sources of those rocks. Their discussion considered both entrainment of core material and a contribution involving core-derived oxide minerals.
This is a dated research result tied to specific samples and measurements. It concerns chemical transfer and mixing, with the transport mechanism still part of the interpretation. Evidence from those different tracers does not retroactively settle the origin of the Klamath osmium grains, turn a basalt into an intact piece of the core, or establish the same history for every volcano. Follow the paper's methods, uncertainties, corrections and subsequent tests when assessing how far the conclusion extends.
A five-question guide to a deep-Earth headline
- What material was actually examined? A whole rock, a separated mineral, an inclusion, or a seismic record can answer different questions.
- Where was it obtained? Separate the collection location from the inferred source depth.
- What is the direct result? Find the measured quantity, the comparison and the uncertainty.
- Which alternatives were tested? Look for mixing, alteration and other reservoirs that could account for the observation.
- What would strengthen the interpretation? Repeated measurements, different samples or an independent evidence type can test how general the explanation is.
For a simple reading note, write three sentences: “They measured …”; “They infer … because …”; “The main remaining question is …”. If the second sentence goes beyond the paper's stated conclusion, narrow it until the evidence supports it.
Continue with the rocks and minerals observation guide for a practical starting point. The tonalite guide shows the same discipline at specimen scale: distinguish visible features, measured composition and the name assigned from them.