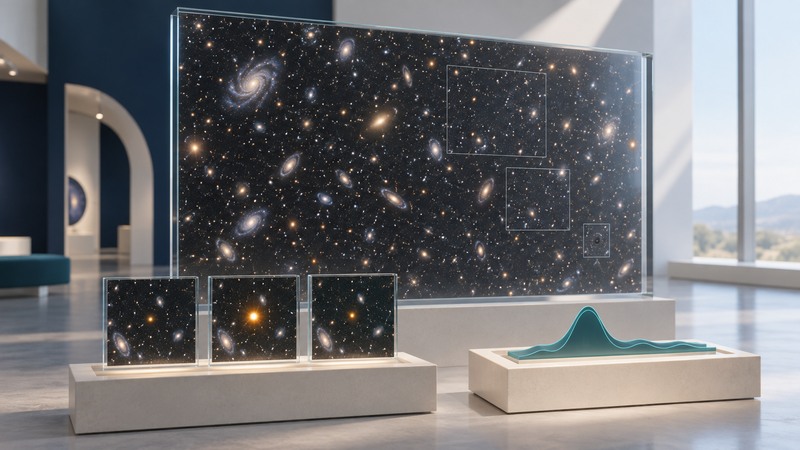
The Nancy Grace Roman Space Telescope is designed to make the changing sky measurable across enormous fields. Its most revealing results will include galaxy catalogs, repeated brightness measurements and statistical comparisons, alongside striking images. To follow the mission well, keep three things together: what Roman measured, how the team processed it and what the evidence allows them to infer.
Start with the mission's current stage
Status checked September 10, 2026: Roman launched on August 30, 2026 aboard a SpaceX Falcon Heavy. NASA describes a roughly three-month journey and commissioning period on the way to its orbit around the Sun–Earth L2 region. The agency's August 30 launch report anticipates releasing the first images by early 2027; that is a stated expectation, subject to change.
During commissioning, engineers and scientists turn on systems, check pointing and optical performance, and calibrate the instruments. A successful deployment or detector test establishes readiness for the next step. A cosmological result requires calibrated observations and an analysis of a suitable sample.
Keep this dated snapshot separate from the current feed. NASA's Roman mission blog is the place to check subsequent milestones; its dated September 1 posts report antenna and sunshade deployment and activation of the Coronagraph Instrument.
A manageable way to follow Roman
- Check the mission blog for operational progress. Read the newest post's date and what was actually completed. The blog offers a subscription link if you want updates in a feed reader.
- Use NASA's Roman mission hub for discoveries and explanations. For a result that interests you, follow the release to its paper, observing program or dataset. Record both the observation date and publication date.
- Use the MAST Roman archive guide for data provenance. Roman's open-data policy provides public access without an exclusive proprietary period. Processing and planned data releases still take time; public availability and a finished scientific interpretation are different milestones.
- Go one level deeper when needed. The Roman Science Support Center at Caltech/IPAC provides instrument information, simulations and specialist resources for microlensing, spectroscopy and the coronagraph.
For a sustainable routine, choose one release per week or month and write a three-sentence note: the measured signal, the supported interpretation and the most useful next check. This builds a record of what changed without requiring you to read every technical paper.
Know which Roman instrument produced the result
The Wide Field Instrument, or WFI, is Roman's 300-megapixel survey camera. Its broad field and repeated observations will let researchers study populations and find rare or changing objects. WFI also has spectroscopic modes, which separate light by wavelength. For an image, retain the filter, field size, exposure and color mapping; for a spectrum, read the axes, units and uncertainty.
The Coronagraph Instrument has a different job: demonstrate advanced starlight suppression for direct observations of nearby giant planets and circumstellar disks. Masks and carefully controlled mirrors reduce glare. Assess its results through the achieved contrast, separation from the star and residual optical artifacts. A technology demonstration can be a major accomplishment while addressing a narrower question than the nature of an Earth-like planet.
Roman and Webb complement each other. Roman supplies wide-field context and candidate populations; Webb can examine selected targets in greater detail and at longer infrared wavelengths. Follow-up depends on the target and observing program. NASA's Roman–Webb comparison explains the relationship. Our infrared telescope guide helps separate field of view, sensitivity and resolution.
Match the scientific claim to its measured signal
Roman's core community surveys organize much of its science. The High-Latitude Wide-Area Survey studies large galaxy populations; the High-Latitude Time-Domain Survey revisits fields to track change; the Galactic Bulge Time-Domain Survey repeatedly observes dense Milky Way star fields. “Time domain” means measuring how sources vary, and cadence means the interval between visits. Other observing programs broaden the mission's reach.
On a narrow screen, scroll the table sideways; keyboard users can focus it and use the arrow keys.
| Result type | What is measured | What makes the inference convincing? |
|---|---|---|
| Weak gravitational lensing | Small statistical patterns in background-galaxy shapes. | Corrections for optical blurring, galaxy distances and intrinsic alignments before inferring the distribution of matter. |
| Galaxy clustering | Galaxy positions and redshift information across a survey volume. | Survey coverage and selection are modeled before comparing the structure with cosmological predictions. |
| Supernova cosmology | Brightness changes, colors, classification and redshift. | Calibrated, standardized distances with dust, population differences and missed events accounted for. |
| Microlensing planets | A background star's temporary magnification, sometimes with a planetary deviation. | Alternative light-curve models and the evidence that constrains the lens and planet properties. |
| Coronagraph detections | Faint light near a star after suppressing its glare. | Tests against residual starlight and background objects, plus the stated sensitivity and observing geometry. |
Dark matter is inferred through gravity; dark energy is the name for the unknown cause of accelerated cosmic expansion. Roman investigates their effects through measurements such as lensing, clustering and supernova distances. NASA's weak-lensing explanation shows why this work combines many galaxies: the small distortions are difficult to establish from one galaxy's appearance.
For planet news, identify the discovery method. In microlensing, a foreground object's gravity magnifies a more distant star. The light curve is the evidence, and a planetary signal can constrain a mass ratio more directly than an absolute mass. Additional observations or assumptions may be needed to turn that into an Earth-mass or Jupiter-mass label. A rendered planet portrait supplies illustration, not a surface measurement.
Recognize simulations, prompt products and data releases
A simulated Roman field predicts how an observation might look and helps test analysis methods. Its known input objects form a “truth” catalog for the simulation. STScI's available practice datasets include simulated preview images and ground-test data; inspect the individual dataset's origin before describing it as a Roman observation of the sky.
Once observations flow, a promptly processed image may use different calibration files from a later uniform release. STScI's data-release documentation distinguishes calibrated individual images, combined images and higher-level products such as catalogs. Save the release identifier, pipeline version and relevant quality flags. The processing plan is evolving, so consult the current documentation for timing.
A revised catalog may change a source's brightness or classification because of improved calibration, separation of overlapping sources or a changed selection rule. Compare the same definition and sample across versions before interpreting the change as astrophysical. For image-color conventions, use our guide to reading space-telescope images and spectra.
Worked example: why a discovery count needs a selection model
This is why “Roman found more objects” needs a denominator: more than which survey, across what area, depth and time interval, using which detection rule? A larger catalog can reflect a more effective search as well as a difference in the underlying population.
Read a surprising result with useful skepticism
- State the measurement. Is the result a brightness, redshift, shape correlation, light-curve anomaly or inferred parameter? Preserve units and uncertainty.
- Identify the comparison. A discrepancy is relative to a particular model, dataset combination and set of assumptions. Check what changes when those choices change.
- Separate random scatter from systematic error. More objects can reduce sampling noise, while a shared calibration error can affect the whole sample. Look for independent tests of the latter.
- Check publication and follow-up status. Distinguish a preprint from a peer-reviewed paper, a candidate from a confirmed object, and an initial result from an independent replication. Peer review adds scrutiny; later measurements can still revise the conclusion.
For a headline claiming changing dark energy, look for the specific parameter constraints and whether Roman data alone or a combination of surveys drives the preference. A tighter constraint is useful even when a familiar model remains compatible. For distant-galaxy claims, our redshift and distance guide explains how to distinguish a candidate's estimated distance from spectroscopic evidence.
Keep a record you can revisit
Download the Roman result-reading notes and open them in a text editor. Save one copy per release, including its URL, dataset version, observed signal, inference, uncertainty and next check. Revisiting the note after a new calibration or follow-up study makes the scientific progress visible.
To learn the data tools, begin with a documented small example from the STScI notebooks and keep its simulation or test-data label attached. AI can help explain unfamiliar terminology or organize your notes; verify its numbers, citations and claims against the release and paper before sharing them. For more context, see AI's role in astronomical data analysis.