Song: Agricultural Pest and Disease Prediction
Agricultural pest and disease prediction is no longer just about classifying a leaf photo after damage is obvious. The harder and more valuable problem is turning weather, scouting, traps, drone imagery, crop stage, and local history into earlier warnings that change what happens next: where to scout, when to spray, where not to spray, and when the apparent signal is too weak to trust.
The strongest current systems combine remote sensing, computer vision, sensor fusion, time series forecasting, variable-rate technology, and a practical integrated pest management workflow. AI matters because outbreaks are context dependent: the same lesion, trap count, or weather shift means different things depending on crop stage, canopy, cultivar, field history, and the biology of the pest or pathogen involved.
This update reflects the field as of March 18, 2026 and leans mainly on UF/IFAS, Cornell NEWA, FAO Locust Watch, USDA ARS, CABI PlantwisePlus, IPM PIPE, and current papers from Frontiers, PLOS, Nature, and PMC. Inference: the most credible systems still tie model output to scouting thresholds, biology, and extension-style decision support rather than treating AI as a stand-alone oracle.
1. Remote Sensing and Imaging Analysis
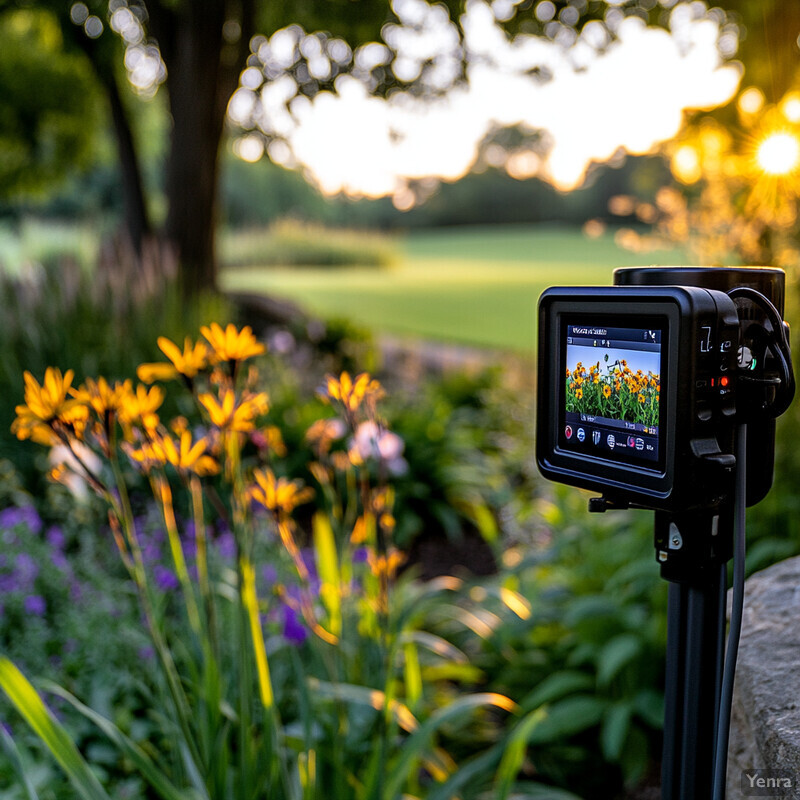
Remote sensing is strongest when it works as large-area surveillance and anomaly triage. AI can detect unusual crop signals from drones, aircraft, or satellites fast enough to narrow where agronomists and scouts should look next, especially for outbreaks that spread faster than field walking can keep up.
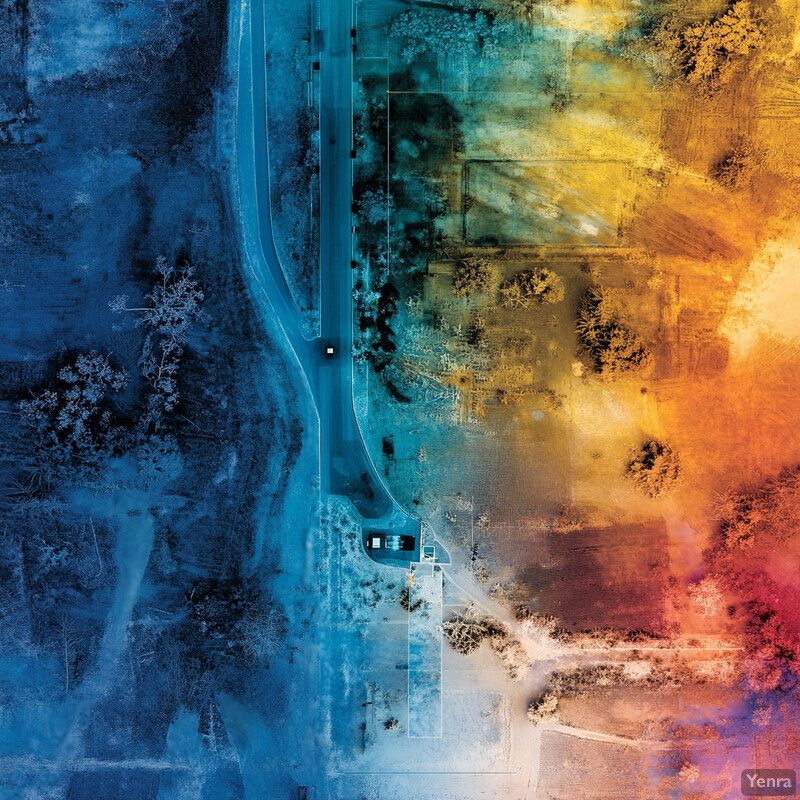
On January 29, 2026, UF announced a grant-funded project using multispectral drone imagery, machine learning, and real-time weather data to detect celery early blight before visible symptoms and support targeted fungicide use. FAO's locust-watch GIS tools show the same operational pattern at regional scale: repeated geospatial layers and field reporting feeding an early-warning system. Inference: remote sensing is excellent for coverage and timing, but still works best as an early-warning layer rather than a stand-alone diagnosis of every plant-level problem.
2. Machine Vision for In-Field Monitoring
In-field machine vision turns scouting from a periodic manual task into a continuous measurement system. Cameras on vehicles, fixed stations, traps, or handheld devices can watch for pest presence, disease-conducive conditions, and symptom progression much more often than human scouts alone.
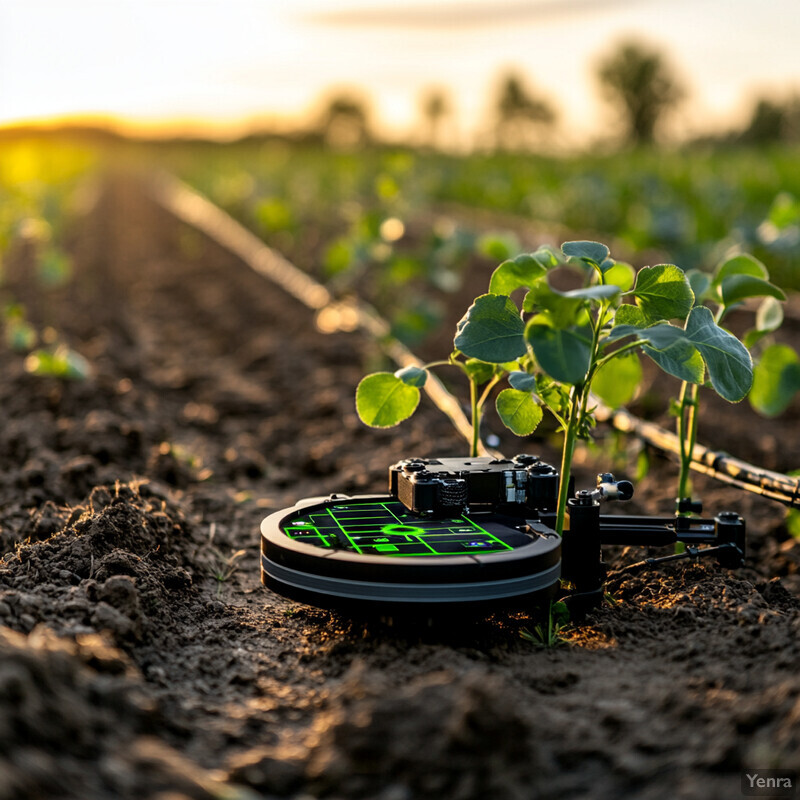
UF's 2024 strawberry disease work showed that an AI imaging system for leaf wetness detected moisture nearly 96% of the time compared with manual observations and reached nearly 84% accuracy compared with current sensors and models in the Strawberry Advisory System. That matters because leaf wetness is not just a visual convenience; it is an input to disease forecasting. Inference: machine vision in crop protection is not only about spotting a bug or lesion in a frame, but also about measuring disease-conducive conditions more reliably in the field.
3. Predictive Modeling Using Weather Data
Weather-based prediction is one of the most operationally mature parts of crop protection. AI helps by fusing more inputs and updating risk more dynamically, but the strongest current systems still remain anchored to phenology, degree-day logic, leaf wetness, and pathogen biology.
Cornell NEWA runs operational crop and pest tools such as codling moth and onion disease forecasting from local weather and biologically meaningful thresholds, while UF's Strawberry Advisory System uses leaf wetness and temperature to guide fungicide timing. Inference: AI weather models become much more trustworthy when they extend proven epidemiology and phenology systems instead of pretending weather alone is enough.
4. Soil Health Analysis
Soil analysis helps pest and disease prediction mostly as a vulnerability layer. Nutrient balance, drainage, compaction, and the soil microbiome can all shift how fast plants succumb to disease or recover from stress, even when the visible canopy looks similar at first.
Cornell's soil-health framework keeps biological activity and physical condition inside one operational scoring system, while a 2025 npj Sustainable Agriculture paper linked practices such as no tillage, cover crops, compost use, and targeted irrigation to microbiome changes associated with crop defense. Inference: soil health is rarely a direct disease alarm, but it is increasingly a strong explanatory layer for why risk rises or stays contained.
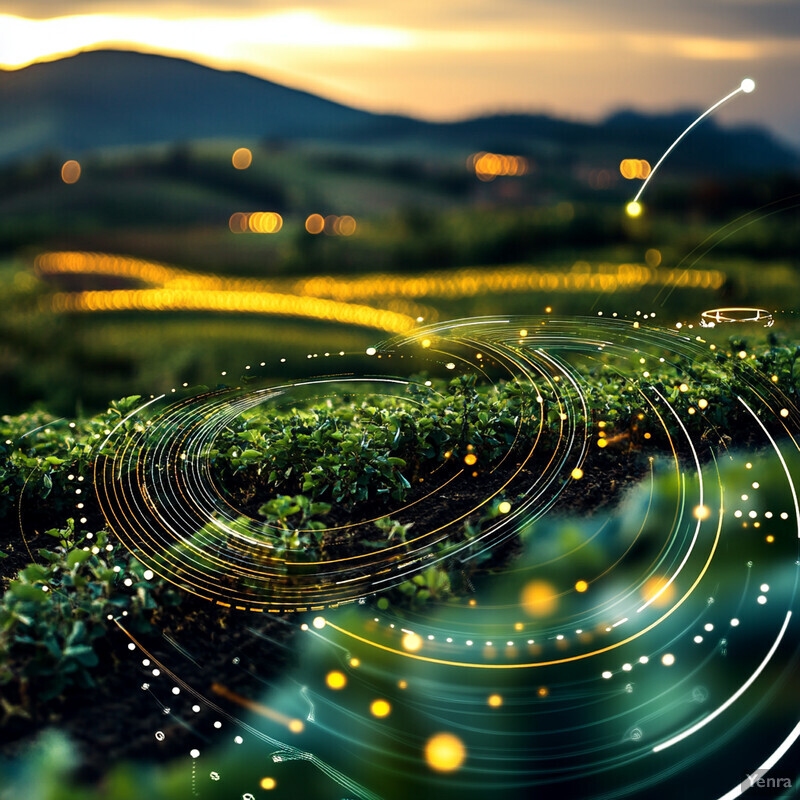
5. Early Warning Systems with Sensor Fusion
Early warning systems improve when they combine signals instead of trusting one device. Trap images, weather stations, canopy measurements, and regional surveillance each see part of the problem; AI helps combine them into a more stable early alert.
FAO's locust-watch system combines field reporting with environmental and geospatial layers for operational early warning, while a 2024 Scientific Reports paper on an IoT-based intelligent pest-management system reported about 97.5% overall accuracy, 98.9% recall, and 97.3% mAP@0.5 for target fruit-fly identification. Inference: sensor fusion matters because one data stream is rarely enough to capture both outbreak risk and actual presence.
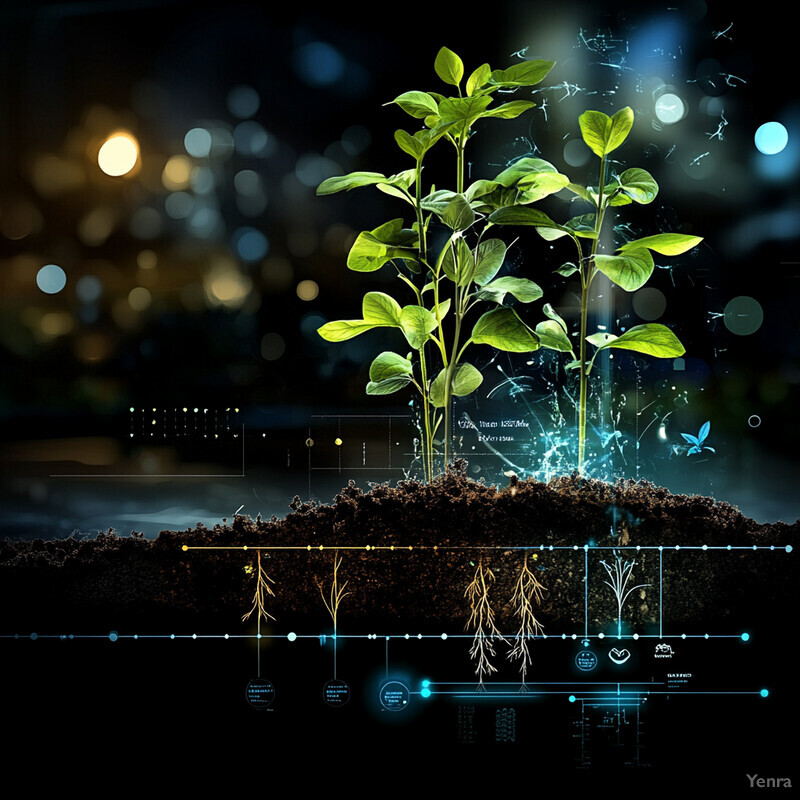
6. Phenotyping and Plant Trait Recognition
Plant-trait recognition matters because pest and disease outcomes depend on host susceptibility, not only on exposure. AI-supported phenotyping helps breeders and agronomists detect which plants, canopies, and symptom patterns are linked to resistance or faster collapse under pressure.
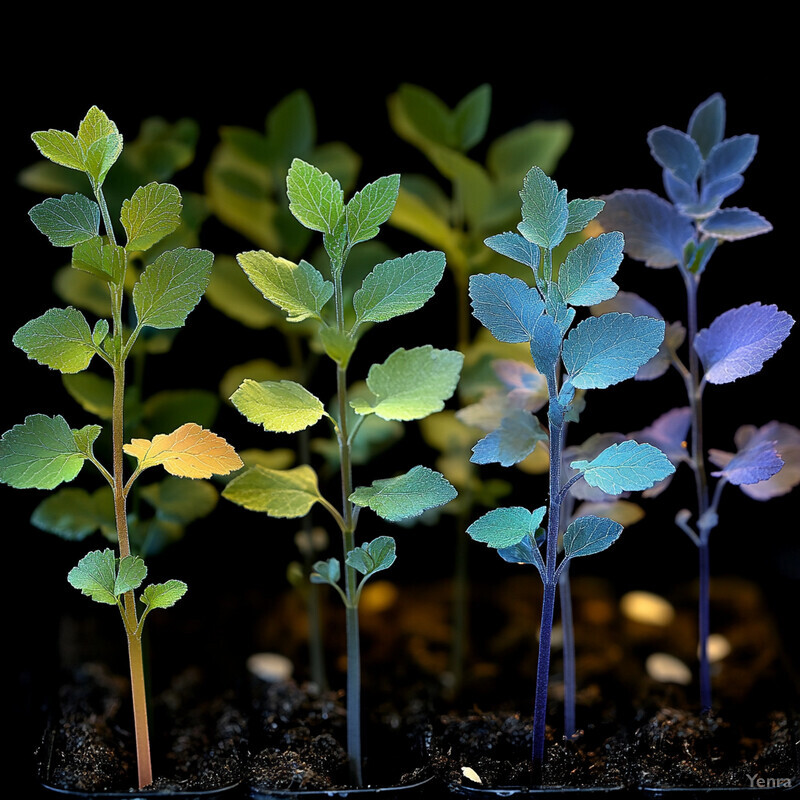
A 2025 review on AI-assisted breeding for plant disease resistance describes how imaging, phenomics, and genomics are increasingly used together to identify resistance-associated traits and guide breeding decisions. Inference: better pest and disease prediction often starts upstream, with better measurement of host traits that change outbreak severity and treatment timing.
7. Automated Identification of Pest Species
Automated species identification is one of the clearest areas where computer vision already saves time. The point is not just classifying clean lab images, but identifying insects and symptoms in trap photos and messy field conditions quickly enough to guide action.

A PLOS Sustainability and Transformation study reported average precision of 92.7% and recall of 93.8% for insect detection from camera-trap images, while a 2024 Frontiers in Plant Science benchmark for grapevine pest surveillance found YOLOv8 achieved 92.0% mAP@0.5. Inference: species ID is one of the most deployable pieces of agricultural AI, but transfer across trap types, lighting, and species mixes still requires testing.
8. Precision Spraying and Variable-Rate Treatments
Prediction becomes economically meaningful when it changes treatment footprint. AI-guided spraying supports variable-rate technology and more targeted integrated pest management by treating likely hotspots rather than spraying every row, tree, or bed the same way.
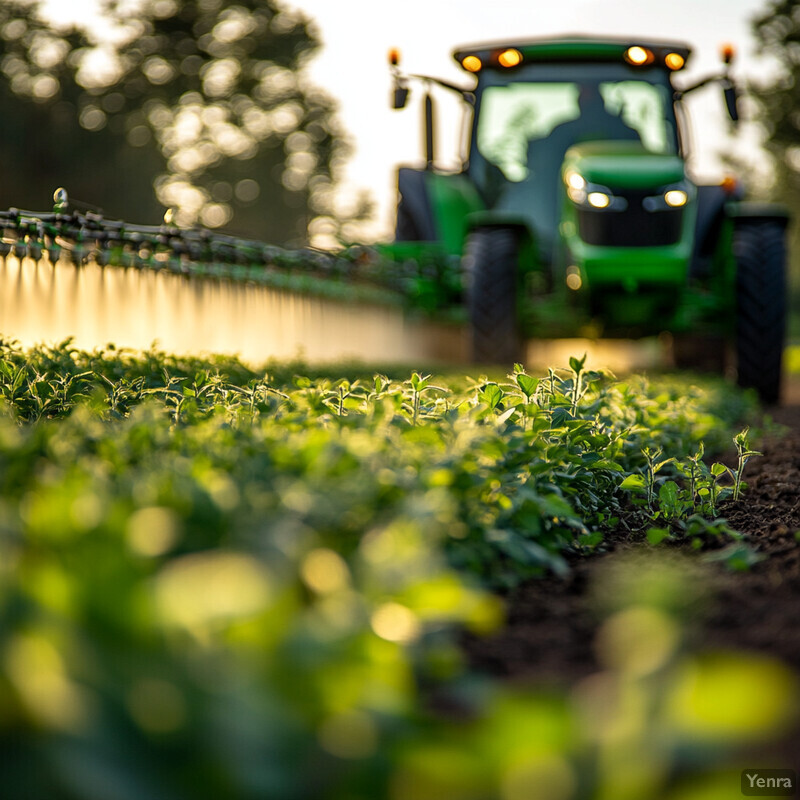
USDA ARS reports that its precision sprayer field tests achieved equivalent pest and disease control while cutting spray drift by up to 87%, ground loss by up to 90%, and pesticide use by 30% to 85%. UF's 2025 AI smart-sprayer work for tomato plastic mulch found punched planting holes 86% of the time and saved more than 90% on herbicide use in those trials. Inference: the best prediction systems are tightly connected to actuation, not separated from it.
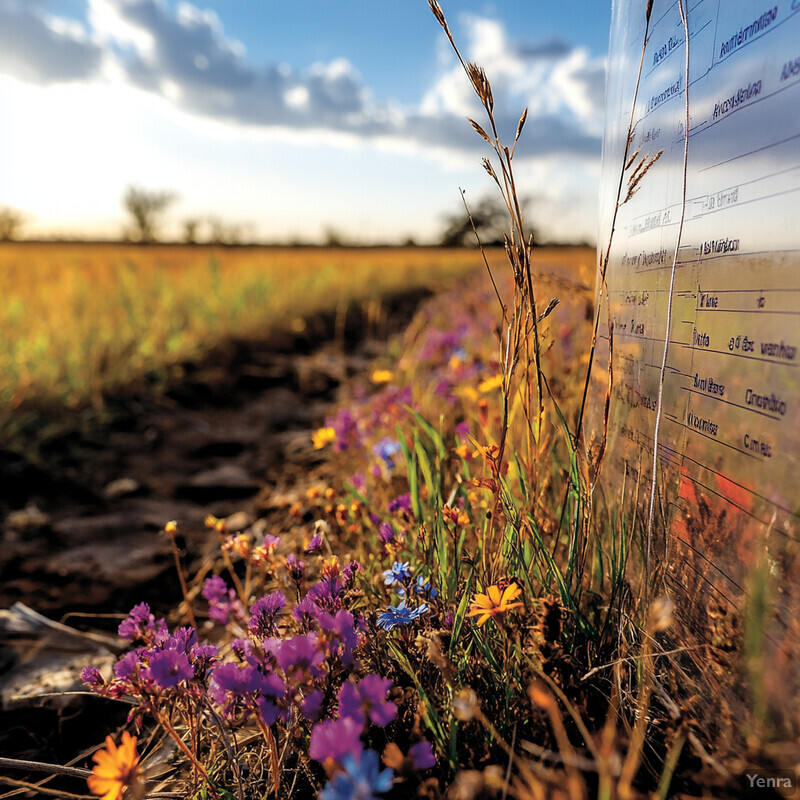
9. Geospatial Risk Mapping
Geospatial risk maps are most useful when they tell growers and agencies where to scout and stage resources next. AI can combine weather, observations, land cover, and regional movement patterns into surveillance maps that are more actionable than static outbreak summaries.

FAO's locust-watch GIS system is a working example of regional risk mapping fed by repeated environmental layers and field data, while IPM PIPE provides live forecasting and maps for downy mildew and other crop threats. Inference: geospatial AI works best when it collapses large search areas into a tractable set of high-priority zones.
10. Long-Term Trend Analysis
Long-term trend analysis matters because pest and disease pressure does not stay fixed. Planting windows, climate signals, resistance pressure, and cropping geography all shift over time, so forecasting systems need repeated recalibration against history.
Operational systems such as Cornell NEWA and FAO's locust-watch infrastructure are built on the idea that repeated seasons of weather, field observations, and outbreak timing matter more than one-off snapshots. Inference: AI trend analysis is strongest when historical baselines stay visible and the model is judged on how well it adapts to shifting seasons rather than just fitting one year.
11. Natural Language Processing for Research Integration
NLP is becoming useful in crop protection mostly as a knowledge-organization tool. It can help convert research papers, advisories, and extension content into structured entities, relationships, and searchable decision support rather than leaving critical guidance trapped in scattered text.

The AgriNER work created a named-entity-recognition resource for agricultural text, while CABI PlantwisePlus maintains curated crop-health resources and advisory materials for field use. Inference: research integration is strongest when NLP helps structure and retrieve trusted agronomic knowledge, not when a language model is left to improvise disease advice from scratch.
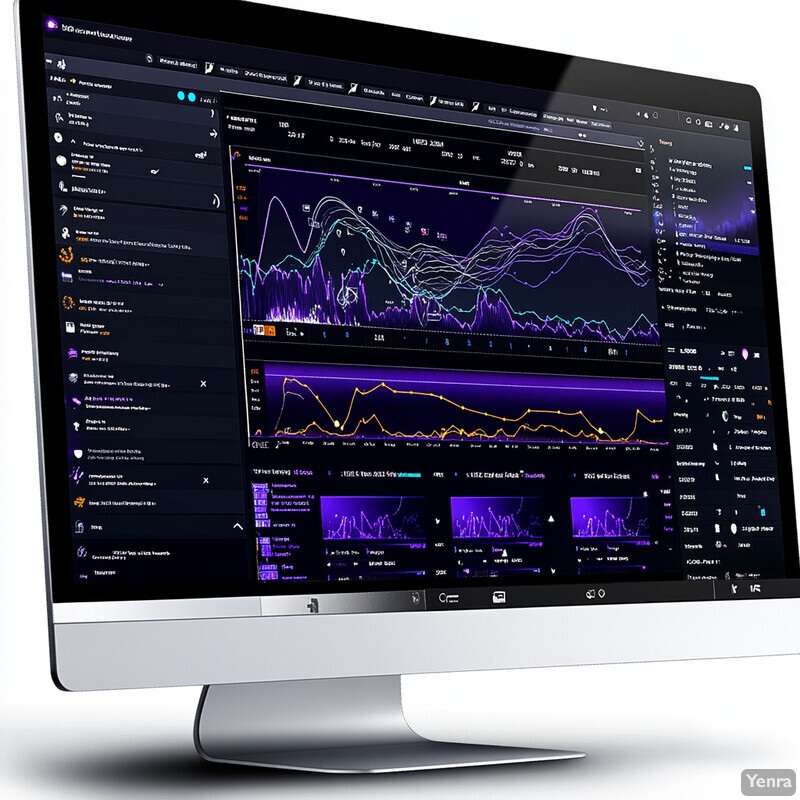
12. Real-Time Alerts and Dashboards
Real-time dashboards matter when they make thresholds, uncertainty, and action windows legible. A good alerting system does not merely say risk is rising; it shows what signal changed, how confident the model is, and what the next scouting or treatment decision should be.
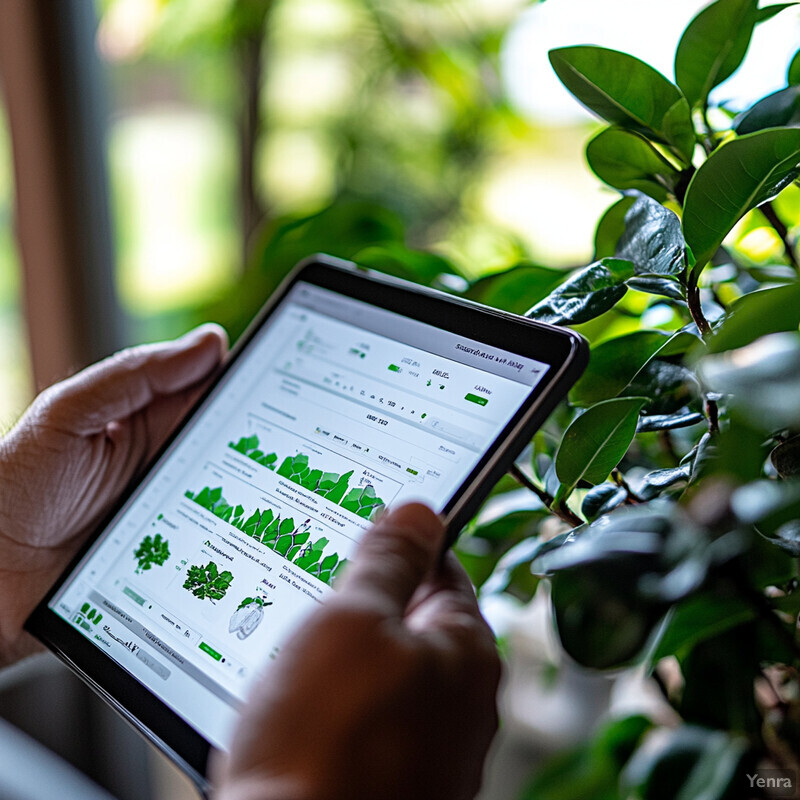
UF's 2026 celery project is building a web platform that lets growers upload drone imagery and receive real-time disease risk assessments tied to local weather, while IPM PIPE already publishes live forecast maps for disease risk. Inference: dashboards are useful when they sit close to operational action, not when they simply restate raw model output.
13. Adaptive Learning Systems
In agriculture, adaptive learning usually means local updating and seasonal recalibration, not uncontrolled online learning. Pest and disease models improve when they keep absorbing new examples from commercial fields, new cultivars, and new weather patterns without forgetting the biology that made older models useful.

UF's celery project explicitly includes commercial field trials with growers and crop consultants, while GranoScan was built from in-field imagery collected with grower participation. Inference: the most credible adaptive systems in crop protection improve because they keep seeing local data and expert feedback, not because they run without guardrails.
14. Farmer-Contributed Data and Crowdsourcing
Farmer-contributed imagery and observations can make models more locally useful, but only when that data is curated. Crowdsourcing works best when extension, agronomists, or trusted platforms help clean labels and connect observations to specific crops, growth stages, and geographies.

GranoScan reported about 94% overall accuracy for in-field identification of wheat biotic threats using grower-facing mobile workflows, and CABI PlantwisePlus runs farmer-advisory programs designed to channel local crop-health observations into practical support. Inference: crowd data are most valuable when they strengthen local relevance and surveillance density rather than replacing expert review altogether.
15. Integration with IoT Devices
IoT matters when it closes the loop between sensing and response. Smart traps, weather stations, leaf-wetness imaging, and connected field devices become useful when they feed an alerting or recommendation layer rather than just generating another stream of unloved data.

The 2024 Scientific Reports smart-trap study showed strong on-device insect detection performance, while UF's Strawberry Advisory System already depends on weather-network integration to drive disease forecasting. Inference: IoT does not improve pest management by existing; it improves it by feeding biologically meaningful signals into forecasting and treatment decisions.
16. Modeling Pathogen Life Cycles
Life-cycle modeling remains one of the most practical forms of pest and disease prediction. When models stay tied to development stages, degree days, infection windows, and crop phenology, they produce timing guidance that growers can actually use.
Cornell NEWA's codling moth and onion disease tools are built to estimate stage progression and treatment timing from weather and biological thresholds. Inference: AI adds the most value when it helps update and personalize these biologically grounded timing systems rather than replacing them with purely statistical forecasts.
17. Multi-Crop and Intercropping Analysis
Mixed-crop systems make prediction harder because disease expression and spread are altered by canopy structure, crop pairing, and microclimate. AI is starting to work here, but this is still a transferability-sensitive area that needs careful validation across cropping systems.
A 2025 Frontiers in Plant Science study on intercropping used hyperspectral imaging and hybrid deep learning for disease detection in maize-soybean and pea-cucumber systems, reporting test accuracy around 99.8% within the study setting. Inference: intercropping analysis is advancing quickly, but the harder next step is proving these models remain reliable across other crop combinations and field conditions.
18. Remote Diagnosis via Smartphone Apps
Smartphone diagnosis is becoming a practical first-line triage tool. It can help a grower or advisor decide whether a problem is likely serious, what the candidate causes are, and whether the case should escalate to lab testing, scouting, or treatment.
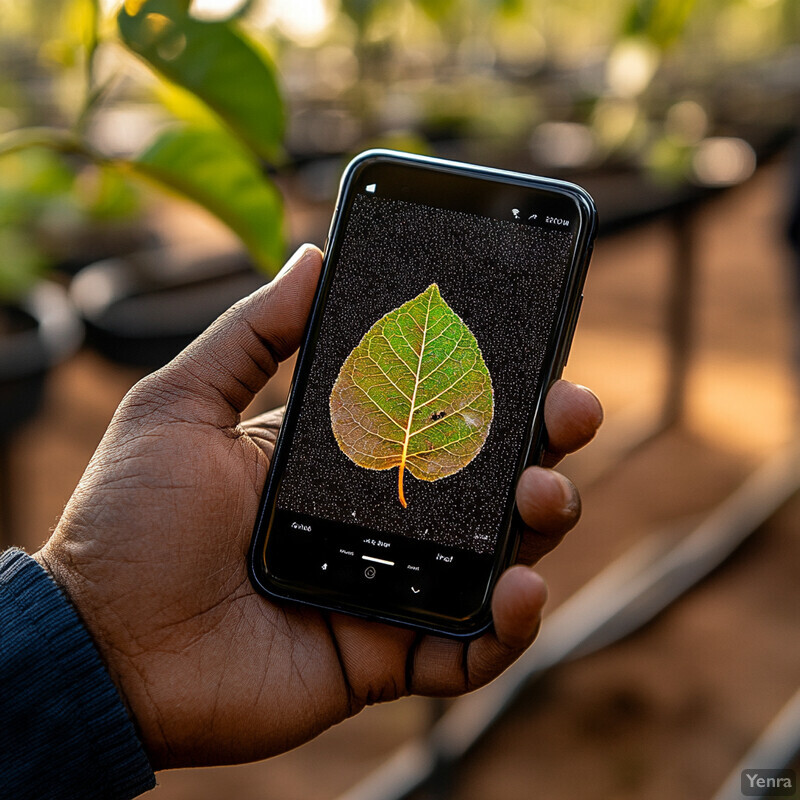
The mPD-App study reported 93.91% accuracy across 14 plant diseases, while GranoScan reported about 94% accuracy on wheat biotic threats in field-facing workflows. Inference: remote diagnosis is already useful for narrowing the problem quickly, but it still depends on image quality, symptom visibility, and sensible escalation when confidence is weak.
19. Risk Indexing and Forecast Models
Risk indices make AI output usable because growers and advisors do not need a wall of model internals. They need a calibrated answer to a simpler question: is this a watch, a scout-now situation, or a treat-now situation?
IPM PIPE and Cornell NEWA are both operational examples of converting biological and weather signals into forecast products that guide action windows, while FAO's locust system turns complex regional inputs into warning categories and maps. Inference: risk indexing works when the score is interpretable, tied to biology, and attached to a next action.
20. Integration with Supply Chain Forecasting
Full supply-chain integration is still emerging, but the practical path is clear: pest and disease predictions increasingly feed harvest confidence, spray planning, loss expectations, and market-facing risk management rather than staying trapped inside agronomy software.
UF framed its 2026 celery disease project around protecting a high-value commercial crop with downstream market significance, and CABI's advisory infrastructure is built to move crop-health intelligence into practical farmer decisions at scale. Inference: the strongest near-term integration is not fully autonomous logistics optimization, but linking field risk earlier to harvest, spray, and market planning.
Sources and 2026 References
- University of Florida: Harnessing AI with drone imagery to detect costly celery disease before symptoms surface
- UF/IFAS: UF scientists use AI algorithm to improve strawberry disease detection
- University of Florida: AI technology uses less herbicide to kill weeds
- Cornell NEWA: Crop and pest management tools
- Cornell NEWA: Codling moth
- Cornell NEWA: Onion diseases
- FAO Locust Watch: GIS and geospatial tools
- USDA ARS: Precision Sprayer Benefits Growers and the Environment
- CABI PlantwisePlus: Resources
- CABI PlantwisePlus: Farmer advisory
- IPM PIPE: Forecasting
- PMC: Artificial intelligence-assisted breeding for plant disease resistance
- PLOS Sustainability and Transformation: Accurate detection and identification of insects from camera trap images with deep learning
- Frontiers in Sustainable Food Systems: Remote sensing and artificial intelligence: revolutionizing pest management in agriculture
- Frontiers in Plant Science: A novel dataset and deep learning object detection benchmark for grapevine pest surveillance
- Frontiers in Plant Science: GranoScan
- Frontiers in Artificial Intelligence: mPD-App
- Frontiers in Plant Science: Smart intercropping system to detect leaf disease using hyperspectral imaging and hybrid deep learning for precision agriculture
- Scientific Reports: IoT-based intelligent pest management system for precision agriculture
- ESWC 2023: AgriNER
Related Yenra Articles
- Precision Agriculture places pest and disease forecasting inside broader field-level decision support.
- Satellite Data Analysis for Agriculture extends crop-health surveillance to larger regions and repeated overhead observations.
- Microbial Soil Health Analysis adds the belowground biological context that often changes disease vulnerability.
- Autonomous Farming Equipment shows how detection and targeted response can be carried into machines working in the field.