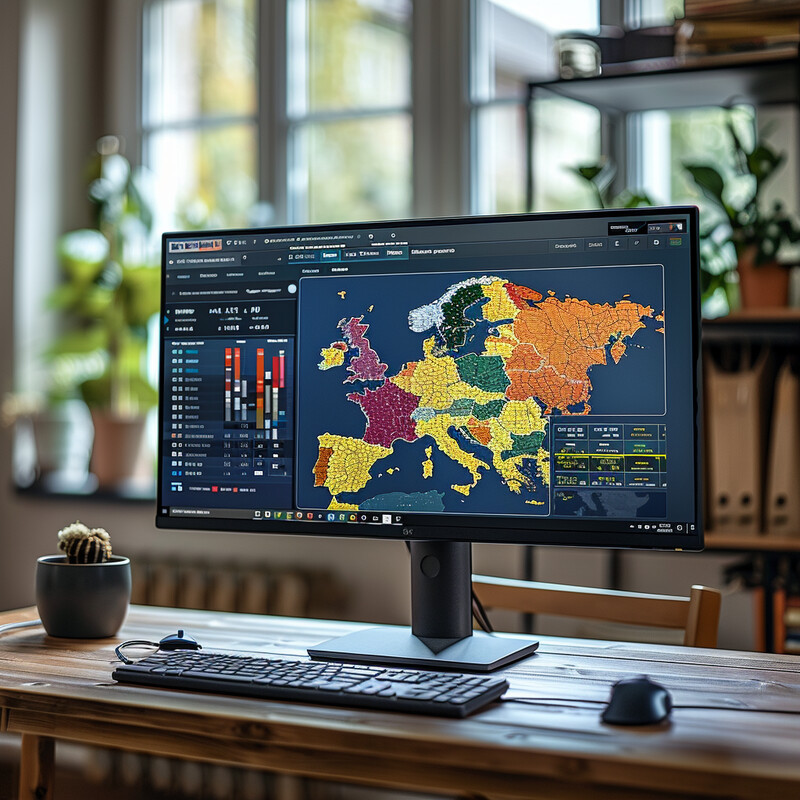
1. Data Integration from Diverse Sources
AI systems aggregate information from a wide array of sources – including polls, economic indicators, social media, and past election data – to create more comprehensive forecasts. By synthesizing these diverse inputs, AI can uncover patterns and correlations that individual data streams alone might miss. This holistic approach provides election forecasters with a nuanced picture of the electoral landscape, improving accuracy by accounting for factors like real-time public sentiment and regional trends. Integrating multi-source data also helps models cross-verify signals (e.g. aligning poll trends with social media chatter), leading to more robust predictions that are less prone to the errors of any single source. In essence, AI-driven integration of disparate datasets ensures that forecasts are informed by the full complexity of the political environment rather than a narrow slice of information.

In the 2024 U.S. presidential election, an AI-powered model by analytics firm Makana 360 exemplified data integration by combining traditional polling data with real-time digital metrics. It continuously tracked 19 million online social media conversations and over 140,000 news articles within 24-hour windows, alongside economic and historical voting data, to feed a multi-layered forecasting. The result was a highly accurate projection – published 48 hours before Election Day – that predicted the electoral vote split between the candidates within a few percentage points of the actual outcome. This success underscores how merging diverse data sources through AI can yield forecasts that closely mirror real election results.
2. Real-time Sentiment Analysis
AI leverages natural language processing to analyze public sentiment in real time, giving election forecasters up-to-the-minute insights into voter moods. By scanning social media posts, news articles, online forums, and other text streams, AI can determine whether public opinion is tilting positive, negative, or neutral toward candidates and issues. This real-time sentiment analysis means that shifts in opinion – for instance, due to a debate or scandal – can be detected immediately rather than waiting for the next poll. Forecasters can incorporate these sentiment trends into their models to adjust predictions as the campaign evolves. Ultimately, AI’s ability to continuously gauge the tone of millions of public interactions enables a dynamic understanding of the electorate’s feelings, making forecasts more responsive to sudden changes in the political climate.

Recent research has demonstrated the power of AI-driven sentiment analysis as a stand-in for traditional polling, especially in contexts where reliable polls are sparse. For example, a 2024 study focused on Mauritius’s election used a multilingual BERT-based AI model to classify sentiment in news articles about the major parties. The AI tracked how positive or negative the media tone was toward each party over time and found that rises in positive sentiment strongly correlated with better projected election performance for that party. In fact, the AI’s sentiment-based forecast predicted the seat counts in Mauritius’s parliament (approximately 37 seats for one alliance versus 23 seats for its rival) purely from media tone. This approach, which closely mirrored the election outcome, shows that real-time sentiment analysis can serve as a reliable alternative to polls, capturing public opinion shifts immediately and accurately.
3. Voter Behavior Prediction
AI improves predictions of voter behavior by mining patterns in vast historical and contemporary datasets. Machine learning models can be trained on past election results, voter surveys, and demographic information to understand how different factors – like age, education, economic conditions, or campaign issues – influence voting decisions. These AI models can then predict outcomes such as voter turnout or party allegiance shifts for upcoming elections under various scenarios. Importantly, AI can capture complex, non-linear relationships in the data (for example, how combinations of factors affect turnout) that traditional analyses might overlook. By continuously learning from new data, AI-based predictors refine their estimates of how specific groups (e.g., suburban young adults or rural seniors) are likely to vote. This leads to more accurate forecasts because the models effectively “learn” the behavior of the electorate and can update predictions as new behavior data comes in.

Academic experiments have shown that AI can closely mirror actual voting behavior, lending credence to its predictive power. In 2023, a Brigham Young University study programmed a GPT-3 based AI to act as “artificial voters” with assigned demographic traits, and then had these AI personas vote in simulations of past U.S. elections. Remarkably, the AI’s voting patterns in the simulated 2012, 2016, and 2020 presidential elections had a “high correspondence” to how real voters cast their ballots. One of the researchers noted being “absolutely surprised” at how accurately the AI’s results matched actual election outcomes. This suggests that AI, when fed sufficient demographic and historical data, can internalize the nuanced behavior of voters. Such models successfully predicted, for instance, the strong alignment between certain demographics and their preferred candidates in those past elections, indicating AI’s potential to forecast future voter behavior with impressive accuracy.
4. Simulation of Electoral Scenarios
AI enables sophisticated simulation of countless “what-if” electoral scenarios, helping forecasters and planners stress-test outcomes under different assumptions. By using agent-based models and Monte Carlo simulations enhanced with AI, analysts can vary inputs like turnout levels, demographic shifts, or even unforeseen events (e.g. economic changes or scandals) to see how they might affect the election result. Unlike static models, AI-driven simulations can model interactions between voters and evolving conditions — for example, how a swing voter might change preference if gas prices rise. These simulations often involve running tens of thousands of virtual elections with slight tweaks each time, something AI can do efficiently. The result is a probability distribution of outcomes (e.g., candidate A wins 70% of simulations), indicating not just a single forecast but a range of plausible futures. This approach provides deeper insight into the stability of a lead or the conditions needed for an upset, making election forecasting more resilient to uncertainty.

Researchers in 2024 introduced ElectionSim, an AI-driven framework that simulates elections by creating a massive pool of virtual voters and running hypothetical election scenarios. Powered by a large language model, ElectionSim was able to generate a synthetic electorate with millions of agent profiles and then simulate their voting behavior under various conditions. In tests, this AI framework successfully replicated the dynamics of the 2020 U.S. presidential election, with the simulation’s state-by-state results closely aligning with the actual outcome (demonstrating the model’s accuracy and realism). The developers report that the system provides “interactive” scenario analysis, meaning analysts can ask the AI how results would change if, say, turnout among young voters increased by 5% or a third-party candidate entered, and the simulation will adjust accordingly. Such AI-powered scenario modeling illustrates how election forecasters can explore long-tail possibilities and complex contingencies, using simulations to anticipate how different factors could sway the race.
5. Targeted Poll Analysis
AI is enhancing the way pollsters conduct and analyze polls by enabling more targeted, adaptive engagement with respondents. Traditional polling struggles with low response rates and shallow insights, but AI-driven polling tools (like chatbots or intelligent survey platforms) can zero in on specific voter segments and even carry out conversational interviews. For example, AI can identify “persuadable” or swing voters and focus polling efforts on them, asking tailored follow-up questions based on their previous answers. This leads to richer data – not only do we get yes/no responses, but we understand the reasoning and emotional tone behind those responses. AI can also quickly process the results to find patterns (such as a particular concern resonating among suburban mothers, or young independents reacting positively to a policy issue). By automating outreach and analysis in this way, targeted AI polling reduces human biases in questioning and yields more granular insights, helping campaigns and forecasters pinpoint changing opinions within crucial demographics or regions.

During the 2024 election cycle, pollsters began deploying AI chatbots to conduct nuanced voter interviews that would be impractical with traditional methods. Notably, the Siena College Research Institute used an AI chatbot named “Engage” to interview so-called persuadable voters – those open to switching preferences – about their views on presidential candidates. Instead of a static questionnaire, the AI engaged respondents in a back-and-forth dialogue, asking human-like follow-ups (“Why do you feel that way?”) to dig into their motivations. According to researchers, this approach allowed them to “interview thousands of people within a matter of a couple hours, and then…analyze it and derive insights very, very quickly,” leveraging AI to speed up and deepen data collection. The result was a trove of detailed qualitative data revealing, for instance, what specific issues might swing those voters and how they emotionally contrast the candidates. This AI-assisted targeted polling gave analysts a level of insight and sample size – in near real-time – that would have been unattainable through traditional phone surveys, illustrating AI’s role in honing in on key voter groups effectively.
6. Geospatial Analysis
AI tools bring advanced geospatial analysis to election forecasting, enabling analysts to capture regional patterns and local dynamics with greater precision. By incorporating geographic data – such as precinct-level results, regional demographics, and even GIS mapping of socioeconomic factors – machine learning models can detect how location-based variables influence voting. This means forecasts can account for neighborhood-level swings or the impact of regional issues (for example, a factory closure affecting one town’s votes). AI can also utilize spatial interpolation techniques to fill gaps where data is sparse, improving estimates in areas with fewer polls. Furthermore, geospatial AI can visualize election data on interactive maps, highlighting hotspots of changing support. The overall effect is that election predictions become sensitive to where votes are coming from, not just how many, refining accuracy by acknowledging that elections are decided through a patchwork of local contests and trends rather than a monolithic national swing.

Incorporating spatial data significantly boosts forecast accuracy, as demonstrated by recent research. A 2025 study in the Journal of Big Data applied machine learning with geospatial and demographic variables to predict election outcomes in Mexican states. The authors found that modeling the geographic context – essentially teaching the AI which regions share similar voting behavior – made the predictions much more precise. In one case, using spatial interpolation methods (kriging) to project early vote counts forward, the model’s predicted vote shares were virtually identical to the final results, strongly outperforming a non-spatial model. Likewise, the study noted that a geographic ensemble approach captured local patterns so well that in a test scenario it achieved a 100% match with actual outcomes in three regional elections. These results underscore that AI-driven geospatial analysis, by accounting for the influence of location and neighboring voting trends, can dramatically improve the fidelity of election forecasts down to the community level.
7. Early Detection of Disinformation Campaigns
AI is becoming a crucial watchdog in elections by detecting disinformation campaigns early, before they can do widespread damage. Machine learning algorithms can monitor social media, news sites, and even deepfake content across the internet, flagging suspicious patterns such as coordinated bot activity or doctored videos that spread false narratives. By analyzing content features and dissemination patterns at scale, AI can often distinguish malicious fake news from organic chatter. Early detection allows election officials, fact-checkers, and platforms to respond quickly – either by debunking the false information, removing or down-ranking fake content, or alerting the public and authorities. This proactive use of AI helps inoculate the electorate against manipulative campaigns by catching lies (like fake endorsements or phony voter guidance) in their infancy. In essence, AI acts as a surveillance network against election misinformation, providing an early warning system that preserves the integrity of information before voters head to the polls.

In the 2024 U.S. election cycle – dubbed by some as the first “AI election” – authorities and researchers used AI tools to successfully identify and neutralize several deceptive campaigns. One high-profile instance was a deepfake audio recording that mimicked President Joe Biden’s voice telling voters not to vote; the AI-generated robocall was quickly unmasked, and the perpetrator faced a $6 million fine from the FCC for attempting to mislead voters. Overall, federal agencies like CISA reported that no AI-driven disinformation had a “material impact” on the election’s integrity, thanks in part to swift detection measures. Researchers monitoring online propaganda noted only a handful of isolated deepfake incidents on Election Day, which were rapidly flagged and debunked before they could gain traction. These outcomes highlight how enhanced AI monitoring and early intervention ensured that, despite numerous pre-election fears, AI-generated disinformation did not tip the scales in 2024’s elections.
8. Enhanced Demographic Analysis
AI allows forecasters to drill down into demographic data with unprecedented depth, revealing how specific segments of the population might vote. Traditional analysis might consider broad categories like “young voters” or “college-educated voters,” but AI can parse many attributes simultaneously – age, gender, education, income, ethnicity, and more – to find complex patterns (for example, young urban college graduates vs. young rural college graduates might show different behaviors). Using large datasets (voter files, census data, survey responses), machine learning can identify which demographic factors most strongly correlate with support for a candidate or likelihood of voting. AI can also segment the electorate into clusters with shared characteristics (“personas”) and predict how each of those groups will respond to candidates or issues. This enhanced demographic granularity helps campaigns tailor messaging and helps forecasters weight their models according to the true composition of the electorate. In short, AI ensures that the rich tapestry of the electorate is properly accounted for, rather than overgeneralized, leading to predictions that respect the diversity of voter groups.

A concrete example of AI-driven demographic analysis in action came in 2024, when the think tank Heartland Forward partnered with an AI polling firm to better capture public opinion across different communities. The AI system (developed by Aaru) ingested detailed geographic and demographic data for several U.S. states and then scraped publicly available information – including social media posts and even voting history records – to “simulate respondents” from various demographic groups in a poll. In essence, the AI constructed a representative sample of voters reflecting the region’s diversity (by age, race, education, etc.) and predicted their survey responses. The results of this AI-conducted poll closely matched the results of parallel traditional polls in those states, validating that the AI’s demographic modeling was on point. Observers noted that this approach helped reach typically underrepresented groups and provided insight into opinions in places where live polling is difficult. The success of the AI-driven demographic analysis – effectively mirroring real-world sentiment across multiple states – demonstrates its value in producing more inclusive and accurate election forecasts.
9. Automated Reporting and Visualization
AI is streamlining the way election results are reported and visualized, often in real time. News organizations and election boards are using AI to automatically generate written updates, maps, and charts as votes come in on election night. For example, natural language generation algorithms can take raw vote counts and output readable news blurbs like “Candidate X leads Candidate Y by 5% with 80% of precincts reporting.” Similarly, AI can power live result dashboards that instantly update graphs and maps, highlighting which counties have flipped or which demographics are trending which way. This automation greatly accelerates reporting – instead of waiting for journalists to manually crunch numbers, the AI produces instant analysis and even explanatory context (like identifying which regions contributed to a swing). Visualization tools driven by AI can also personalize the data for users, allowing them to interact (e.g., filter the map by turnout or view historical comparisons). By automating these tasks, AI not only makes election data more accessible and understandable for the public in real time, but it also frees up human analysts to provide deeper commentary rather than focus on routine reporting.

In the November 2024 general election, a regional news outlet in California piloted an AI-assisted workflow to automate their election night reporting across 13 counties. The team at Bay City News used web-scraping bots and AI scripts to pull in vote counts from each county’s election website as they were updated, and then fed that data into a live online dashboard. They employed OpenAI’s ChatGPT and Anthropic’s Claude to transform the raw data into structured updates and visual elements on the site, effectively creating a real-time results portal for dozens of local races. The AI handled tasks like standardizing disparate data formats and populating pre-designed templates with the latest counts, which meant that within seconds of a county posting new numbers, the info was available to readers in a clear format. While some manual oversight was still required (due to variations in county data feeds), the experiment demonstrated that a huge portion of routine election-night reporting – updating vote tallies, generating text summaries for each race, and rendering charts – could be automated. This allowed the newsroom to deliver timely, detailed results to the public with far fewer staff hours, showcasing AI’s ability to enhance both the speed and presentation of election result reporting.
10. Predictive Analytics for Long-term Trends
Beyond immediate elections, AI is instrumental in forecasting long-term political trends and shifts in the electorate. By analyzing decades of historical voting data alongside demographic and socioeconomic projections, AI-driven models can help predict how changes in society might influence future elections. For instance, machine learning can be used to project the impact of an aging population, population migrations, or educational attainment increases on party support over the next 10 or 20 years. These models often identify which variables (e.g. age or income) most strongly drive voting changes and then extrapolate how those variables are expected to evolve. With scenario analysis, AI can also examine multiple “futures” – such as higher immigration rates or different economic conditions – to see how each would tilt the political balance. Political strategists and scholars use these long-horizon forecasts to anticipate emerging battleground states or the rise of new voter coalitions. In essence, AI’s pattern recognition and predictive power enable a forward-looking view, turning massive datasets about voters into actionable predictions about the direction of democracy in the coming decades.

Data scientists are now employing AI to parse out the fundamental demographic drivers of voting behavior, which is key to projecting long-term trends. A 2025 study, for example, used machine learning on a large electoral dataset and found that a handful of variables – notably age, education level, and income – were consistently the strongest predictors of how people vote. By recognizing the outsize influence of these factors, analysts can simulate how gradual shifts (like an aging electorate or rising education rates) will affect future election outcomes. Indeed, leveraging such insights, researchers with the States of Change project have modeled presidential election scenarios up to the year 2036, showing how generational turnover and growing racial diversity could reshape party coalitions if current trends hold. These AI-informed projections indicate, for instance, that states which are currently competitive may tilt toward one party as younger, more diverse generations replace older voters. Such long-term predictive analytics, grounded in demographic data and enhanced by AI’s ability to detect enduring patterns, provide a strategic roadmap for anticipating the evolution of the U.S. electoral landscape over the next decade or more.