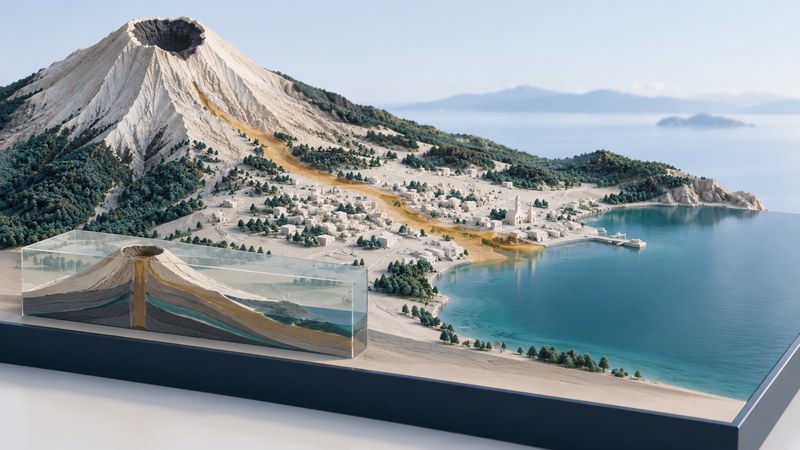
Goma’s geography brings a city, an international border, a large lake, and an active volcanic landscape into a small area. To understand the January 2002 eruption, start with where those features lie, then examine a dated map of the lava flows. The pattern explains why damage to a narrow corridor could disrupt movement across much of the city.
Locate the volcano, city, lake, and border
Goma is in the eastern Democratic Republic of the Congo, on the northern shore of Lake Kivu near Rwanda. Nyiragongo rises to the north. The Smithsonian’s Global Volcanism Program profile places it in the Albertine Rift volcanic province and gives its elevation as 3,470 metres. Nearby Nyamuragira is a separate volcano; check names as well as positions when comparing reports.
Begin at a regional scale so the lake and national boundary are visible together. Then zoom to the city and identify the airport, main roads, and shoreline. Finally widen the view to include the volcano. This sequence keeps a city-scale damage map connected to its wider physical setting.
Three layers answer different questions. Relief describes the shape of the ground. Roads and buildings describe where people and infrastructure are located. A dated eruption layer describes where a particular event left evidence. Overlaying them can reveal intersections, but each layer still needs its own date, legend, and source.
Read January 2002 as a specific event
The eruption began on January 17, 2002. Smithsonian reports describe a fracture system extending down the southern flank, with lava emerging at several locations. Flows crossed Goma, and one branch entered Lake Kivu. A summit symbol alone therefore gives an incomplete picture of where lava reached the surface.
In the profile’s historical bulletin section, find Figure 12, the OCHA map of the January 17–21 flows. It shows the eastern part of Goma separated from the rest of the city by lava. The accompanying account describes relief workers using boats to move between eastern and western areas. This is a concrete example of how disrupted connections can matter beyond the surface area directly covered.
Use the map as a record of the 2002 event. The Global Volcanism Program also documents later activity, including the 2021 eruption. Check the observation period of any report you open; the page’s newest report and an older figure describe different moments.
Interpret the January 28 satellite image
Open NASA’s ASTER image of Nyiragongo and Goma. The observation was acquired on January 28, 2002. NASA identifies Goma on Lake Kivu’s northern shore and explains that clouds obscure the volcano itself. Bright red ribbons represent hot lava flows in this particular false-color combination.
The caption explains the processing: a thermal band supplies red, while two infrared bands supply green and blue. Consequently, the red is a way of displaying sensor information. Read that explanation before treating the image as ordinary visible-color photography.
- Establish the frame. Record the acquisition date and locate the lake shore. Use the caption’s stated 21-by-24-kilometre coverage to understand the size of the scene.
- Locate the city. Identify the urban area beside the water, then look for the airport and other features that help align it with a reference map.
- Follow the colored features. Describe their direction and relationship to the city using the caption’s interpretation of the bands.
- Record the missing view. Clouds obscure the summit area. State that limitation alongside any observation about what the image shows.
A useful observation is specific: “the displayed hot-flow features extend toward the city and lakeshore in an image acquired after the eruption began.” Estimating a flow’s speed would require positions at different known times and compatible measurements. One frame supplies a spatial pattern at one observation time.
Compare an image, an event map, and a report
| Question | Useful evidence | Interpretation check |
|---|---|---|
| Where are the major landforms? | A regional topographic map | Check scale, heights, lake shore, and volcano names. |
| Where did the 2002 flows cross the city? | The dated OCHA event map reproduced by Smithsonian | Read the mapped period and compare crossings with roads and urban districts. |
| What did a satellite observe? | The January 28 ASTER scene | Read band meanings and identify cloud-obscured areas. |
| What was reported afterward? | A bulletin with its observation dates and named sources | Separate field observations from preliminary estimates and interpretation. |
For a short comparison, choose one intersection between a mapped flow and a transport connection. Write down what the map establishes, then find whether a dated report describes its effect on movement. This separates the visible geographic relationship from the evidence about people’s experience.
Finish with a map caption of your own: identify the place, event period, source, and one supported conclusion. Keep the publication date separate from the date of the observation. For present activity, follow the latest dated scientific reports and local authorities’ information; this historical exercise does not establish current conditions or an evacuation route.
Related reading
- Earth imagery comparison: Check acquisition dates and processing before comparing surface changes.
- Reading 3D maps: Inspect the relationship between terrain, viewpoint, and apparent slope.
- Isla Calafia: Compare how a second geological case separates observations from reconstruction.