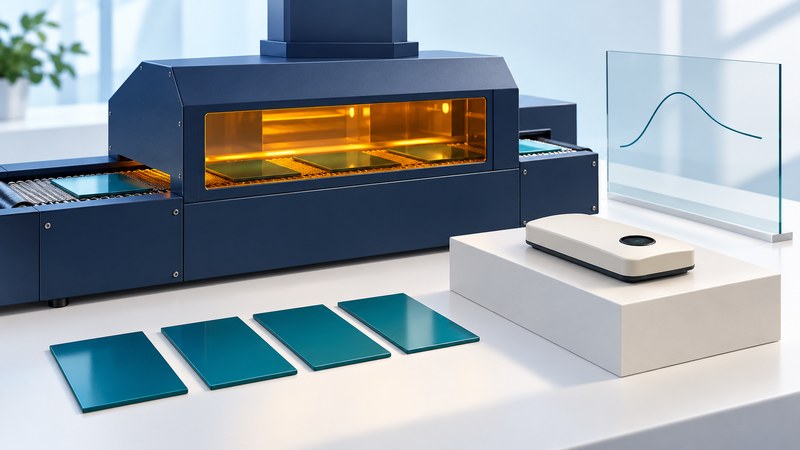
A useful UV curing record connects the radiation reaching the work to the properties of the cured material. Record the instrument, spectrum, measurement geometry, exposure profile, and product-test method so a later reading can support a valid comparison.
This guide is for printing, coating, and adhesive process engineers. Begin with the approved material/process specification, source documentation, radiometer manual, and required product tests. Use the equipment's protective enclosure and approved measurement procedure; a process radiometer is not a substitute for an occupational exposure assessment.
Keep peak irradiance and exposure separate
Irradiance describes radiant power per area, commonly reported in W/cm². Radiant exposure, often called energy density or dose in curing work, accumulates irradiance over time and is commonly reported in J/cm². Record the spectral band associated with either number.
EIT's profiling-radiometer note explains that a displayed peak can come from one lamp while accumulated exposure includes several lamps. Retaining the profile can reveal changes hidden by a single total.
Match the instrument to the source
A radiometer's response depends on its complete optical system and spectral band. EIT's LEDCure documentation specifies different band responses for different LED applications. Record the exact instrument and band rather than comparing two readings labeled only UV.
The manufacturer's UV LED measurement discussion also describes under-reporting when a source exceeds an instrument's dynamic range or mismatches its spectral response. Check both the low and high measurement limits and the calibration status. A flat-topped profile may require an instrument-range investigation before any process adjustment.
On a narrow screen, scroll the table horizontally. Keyboard users can focus it and use the arrow keys.
| Record | Why it matters | Useful check |
|---|---|---|
| Source identity and spectrum | Lamp and LED sources can differ substantially in spectral output. | Match the source to the radiometer response and material specification. |
| Instrument, band and calibration | Numbers depend on the sensor's response and usable range. | Retain model, serial number, band, calibration and condition checks. |
| Position, height and orientation | The sensor must represent the intended measurement plane. | Use the same approved fixture and position for repeat runs. |
| Speed, source settings and profile | Peak and total exposure can change differently. | Save the profile and verify actual operating conditions. |
| Material and product test | The process exists to produce an acceptable cured material. | Link batch, thickness and test results to the exposure record. |
Connect readings to a validated product window
Choose product tests that establish the required function: for example, specified adhesion, hardness, bond performance, or chemical resistance measured after the prescribed conditioning. A surface that feels dry supplies only limited evidence. Agree on the test method and acceptance requirement with the material supplier and responsible engineer.
Dymax's conveyor light-curing validation guide links exposure/intensity trials to cured material properties and controlled geometry. Use that relationship to build a documented process window for the actual formulation, thickness, substrate, and equipment. Its guidance does not make one exposure number transferable to every coating or adhesive.
During a controlled trial, vary one planned factor while preserving the others, retain the exposure profile, and test the resulting product. Include plausible production variation and define what triggers a hold or investigation. If several lamps contribute, evaluate the profile across the relevant width and route rather than relying only on a central pass.
Investigate drift with the measurement setup intact
Repeat a questionable reading using the established procedure and check instrument condition, orientation, speed, source status, and geometry. Compare the profile with the accepted baseline. A changed peak with a similar total may indicate a different distribution of exposure; a stable meter result with failing product tests may point toward material, thickness, substrate, or test-method changes.
Record the investigation and repeat both measurement and product tests after an approved correction. Revalidate when the source spectrum, formulation, layer thickness, conveyor geometry, or radiometer changes. Keep these records alongside production monitoring so a process change can be traced to the affected work.
Use the working record
Download the editable uv process measurement record. Save a copy, complete the actual requirements and evidence fields, and review open issues with the responsible owner. The plain-text record includes instructions, units where needed, the fictional example, and source references.