Satellite agriculture has moved well beyond pretty NDVI maps. The harder and more useful problem is turning repeated orbital observations into decisions that change what happens on the ground: which field should be rescored, which zone is drifting dry, which parcel boundary is wrong, which farm needs flood or salinity review, and which reported crop or practice looks implausible.
The strongest current systems combine earth observation, remote sensing, crop classification, change detection, GIS, data assimilation, and time series forecasting. AI matters because agriculture is a repeat-observation problem: the model has to make sense of phenology, clouds, mixed pixels, field boundaries, weather shocks, and management timing fast enough to guide action before the season is over.
This update reflects the field as of March 18, 2026 and leans mainly on NASA, ESA, the European Commission, Earth System Science Data, Remote Sensing, Scientific Reports, Frontiers in Sustainable Food Systems, Atmosphere, and Nature Communications. Inference: satellite AI is strongest when it is tied to ground truth such as farm records, soil samples, scouting, or payment-system parcel data, not when imagery is treated as a stand-alone oracle.
1. Improved Crop Yield Prediction
Yield prediction is strongest when satellites are treated as one stream in a seasonal model instead of a magic answer by themselves. Current systems combine imagery, weather, soils, management history, and in-season observations to update field and regional expectations before harvest, supporting input, storage, insurance, and marketing decisions.
NASA's 2024 Agricultural Digital Twin program is explicitly aimed at improving crop-yield forecasts for farmers, while NASA's 2024 Spinoff profile on SIMA Harvest shows satellite observations are already feeding operational prediction tools. Inference: the frontier is less about making one preharvest guess and more about updating yield expectations as weather and crop condition evolve.
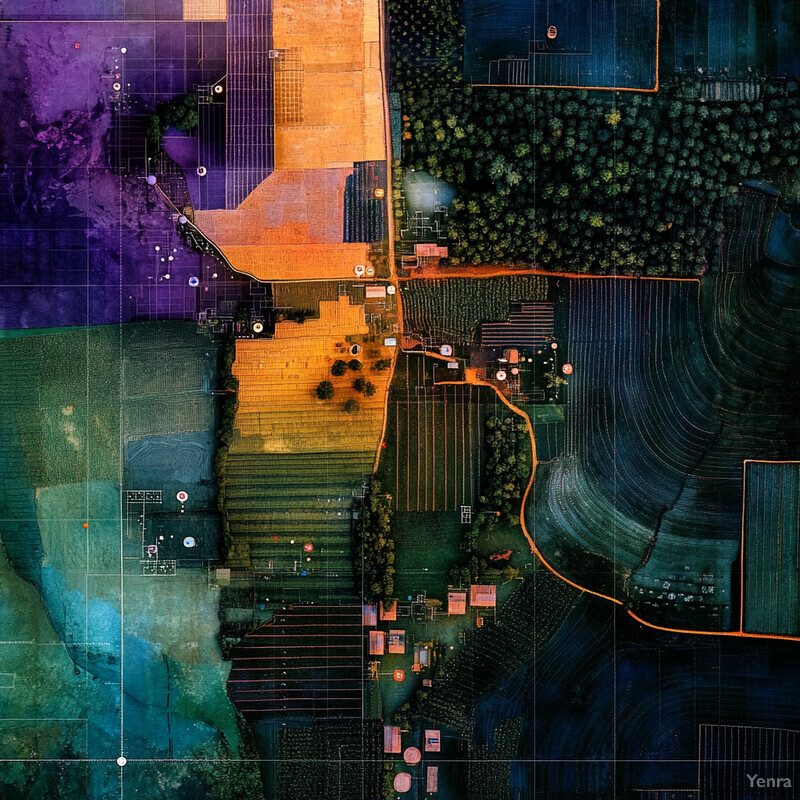
2. Automated Land Cover Classification
In agriculture, land-cover classification is really becoming high-quality crop classification. The best systems do not merely separate cropland from forest or water; they identify crop types, field status, and seasonal signatures at parcel or near-parcel scale so agencies, insurers, buyers, and growers can work from the same map.
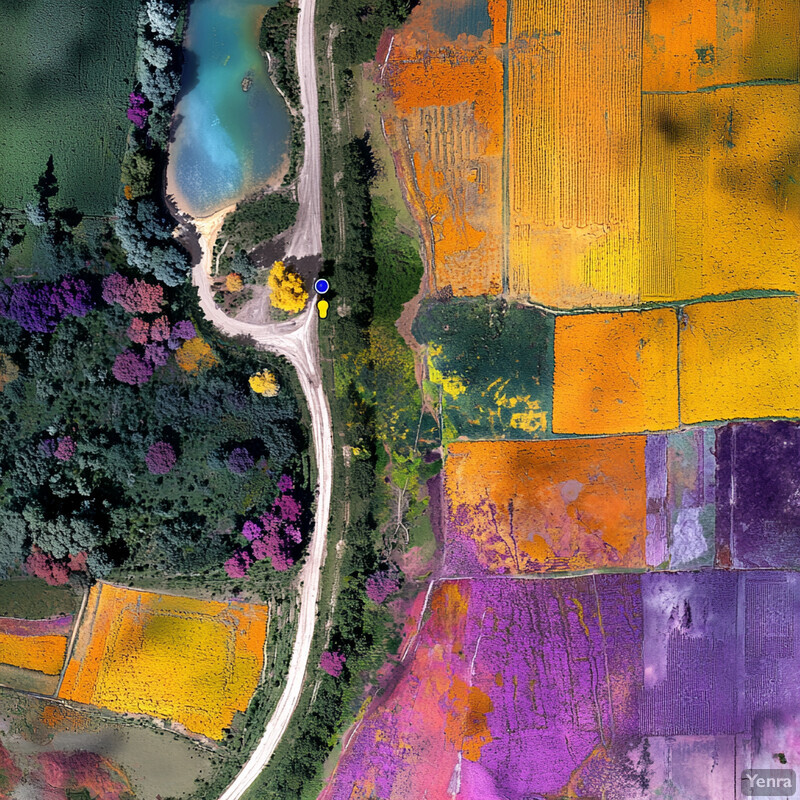
ESA's WorldCereal program is built to support global crop monitoring at field scale, and a 2025 ESSD preprint describes a 10-meter annual maize and soybean map for the contiguous United States. Inference: classification quality is improving not just because models are better, but because the label systems, temporal stacks, and parcel logic are getting closer to how agriculture is actually administered.
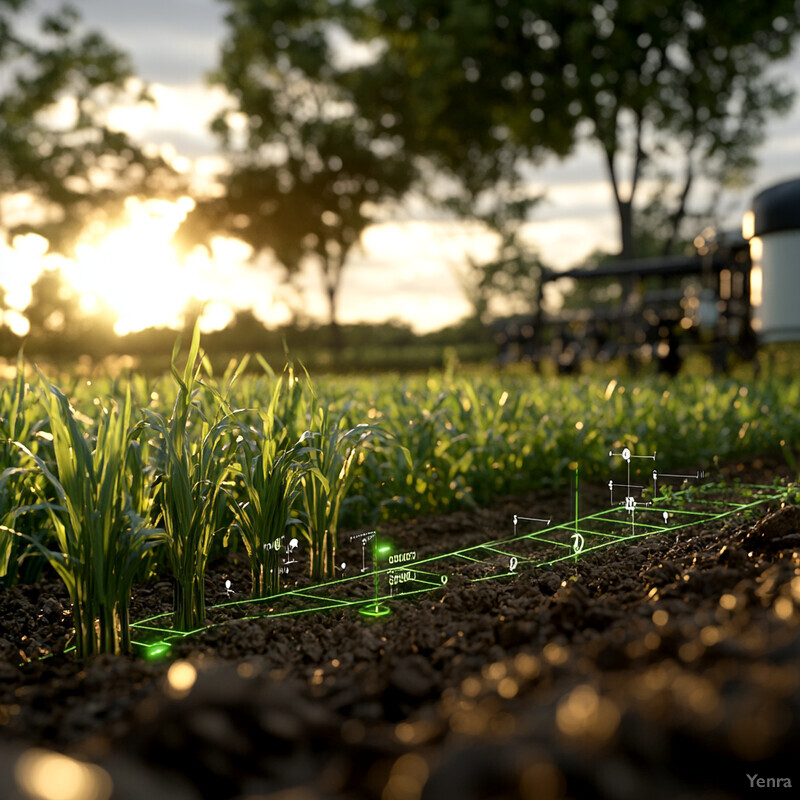
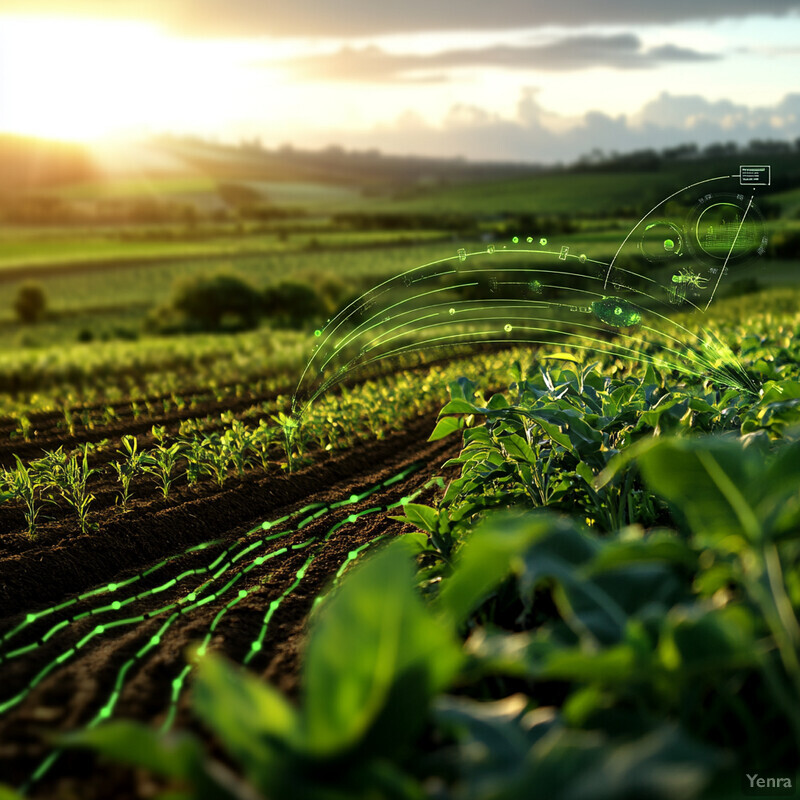
3. Dynamic Crop Health Monitoring
Crop-health monitoring is increasingly a time-series problem rather than a one-image problem. AI can now combine repeated optical, radar, and derived vegetation signals to detect abnormal development, delayed emergence, storm damage, water stress, or stand variability and push those anomalies into scouting or advisory workflows.
NASA JPL says NISAR will help map crop growth, track plant health, and monitor soil moisture from planting to harvest, while a 2026 ESSD paper released a near-real-time global FPAR dataset designed to support time-sensitive monitoring. Inference: operational crop-health AI is moving toward repeated canopy-status products that can be compared week by week rather than static vigor snapshots.
4. Soil Moisture Estimation
Soil-moisture estimation is one of the clearest examples of where AI improves satellite agriculture by fusing sources that do not line up neatly on their own. Coarse global products, optical signals, radar, terrain, land cover, and weather can be combined into finer field-level moisture estimates for irrigation and drought decisions.
NASA's SMAP mission remains a core global soil-moisture source, and a 2024 Remote Sensing paper showed machine-learning fusion of SMAP, Landsat, and related inputs materially sharpened root-zone soil-moisture estimates beyond the raw coarse product. Inference: the value of AI here is not replacing physics, but helping reconcile sensors and scales quickly enough to matter on working farmland.
5. Precise Pest and Disease Outbreak Alerts
Satellite AI can support pest and disease warning, but the strongest current use is anomaly-led triage rather than final diagnosis from orbit. Repeated imagery can highlight fields or subregions that are behaving abnormally relative to crop stage and weather, helping scouting teams focus attention earlier and more efficiently.
A 2025 Frontiers in Sustainable Food Systems review argues that remote sensing and AI are becoming important in pest management, but also makes clear that deployment strength still depends on pairing imagery with agronomic and scouting context. NASA's agriculture overview similarly frames satellite data as a broad monitoring layer rather than a leaf-level diagnostic tool. Inference: outbreak alerting is real, but field confirmation is still part of the workflow.
6. Weed Detection and Differentiation
Satellite weed analysis is getting more practical, but the ground truth is that it still works best as a zoning layer rather than a plant-by-plant detector. AI can identify likely infestation gradients, rescouting targets, and problem parcels, while finer drone or machine-vision systems handle the last mile of precise treatment.
A 2025 Agriculture study showed remote-sensing features could model weed infestation levels in maize fields, but the setup was still about estimating infestation intensity rather than resolving every weed. Inference: the mature workflow is multi-resolution, with satellites ranking where to look next and closer sensors handling action-level detection.
7. Optimized Fertilizer Application
Satellite-based nutrient management is becoming more actionable because AI can convert repeated canopy and soil-related signals into zones for variable-rate technology. The practical win is not that orbit directly measures every nutrient perfectly, but that it helps farms stop treating highly variable fields as if every acre needs the same input rate.
A 2024 Remote Sensing paper used Sentinel-2 to estimate potato nitrogen and biomass status, while a 2025 Scientific Reports paper used synthetic Sentinel-2 data to improve soil total nitrogen mapping. Inference: fertilizer optimization is strongest when AI uses imagery to narrow probable nutrient conditions, then lets agronomy, sampling, and equipment control close the loop.
8. Accurate Yield Estimation at Various Scales
Yield estimation at scale depends on keeping field and regional models consistent with one another. AI helps connect parcel-level observations, county or national forecasting, and repeated vegetation dynamics so that the same observation system can support both farm decisions and broader supply outlooks.
NASA's Agricultural Digital Twin effort is explicitly about better crop-yield forecasts, and the 2026 near-real-time global FPAR release adds a standardized vegetation signal that can be updated continuously across large geographies. Inference: multi-scale yield modeling improves when repeated canopy metrics and operational forecasting logic share the same temporal backbone.
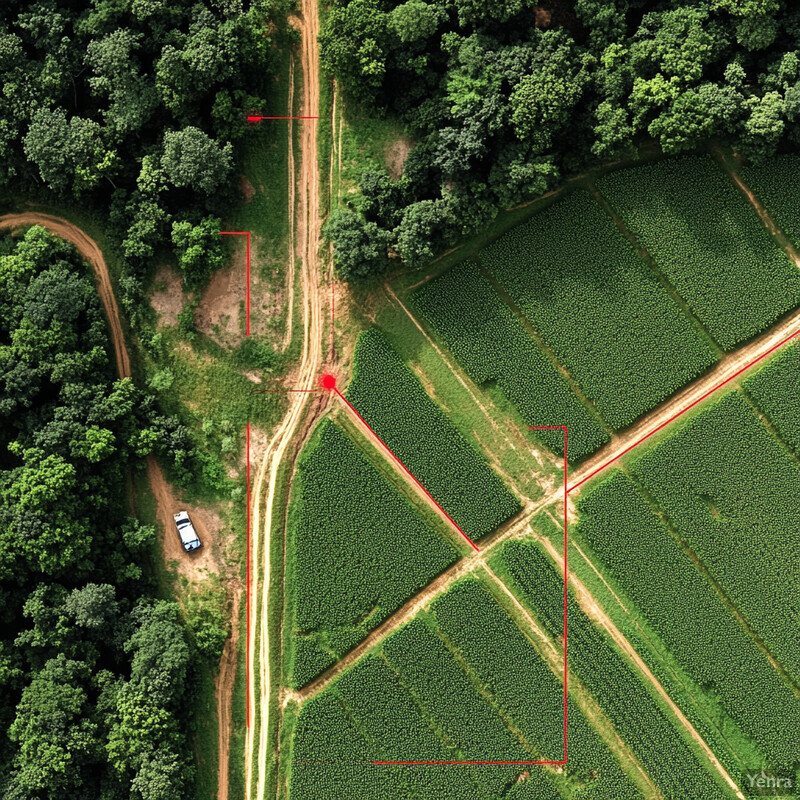
9. Field Boundary and Farm Plot Detection
Field-boundary detection is a foundational agricultural AI task because every downstream decision depends on the parcel being right. Better boundaries improve crop maps, subsidy controls, agronomic zoning, traceability, and any GIS-based workflow that assumes the field polygon is trustworthy.
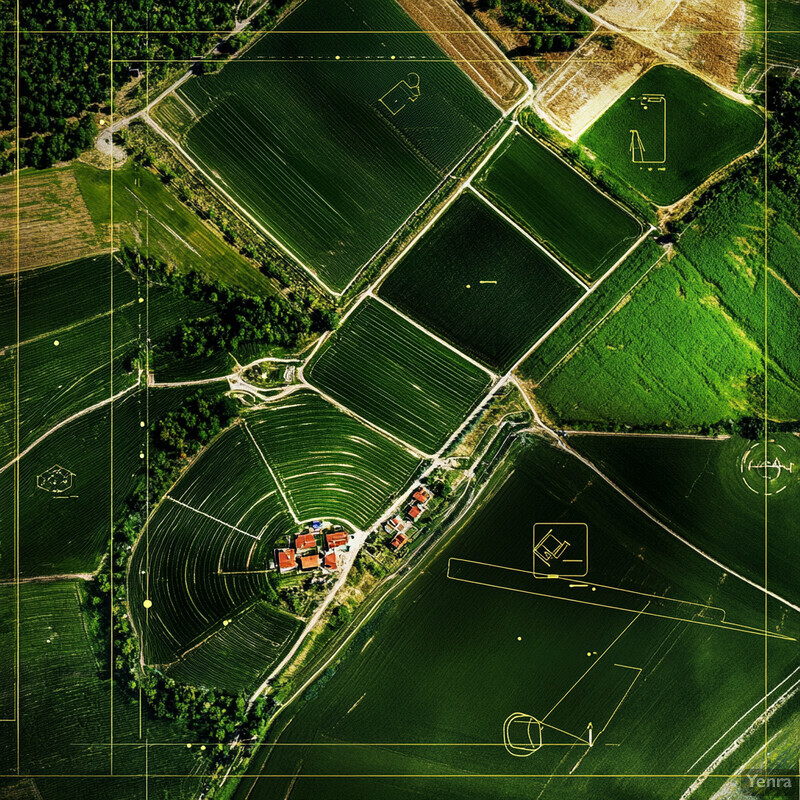
The AI4Boundaries dataset in ESSD was created specifically to advance field-boundary mapping from Sentinel-2 and aerial photography, while ESA's CropCloud project focuses on field-level crop monitoring services. Inference: parcel detection is becoming a reusable infrastructure layer, not a one-off preprocessing step for each project.
10. Real-Time Drought Monitoring
Drought monitoring has become more useful when AI treats it as a moving combination of soil moisture, vegetation condition, and weather trajectory rather than one static index. That matters for agriculture because flash drought and delayed rainfall effects can change management decisions within days, not months.
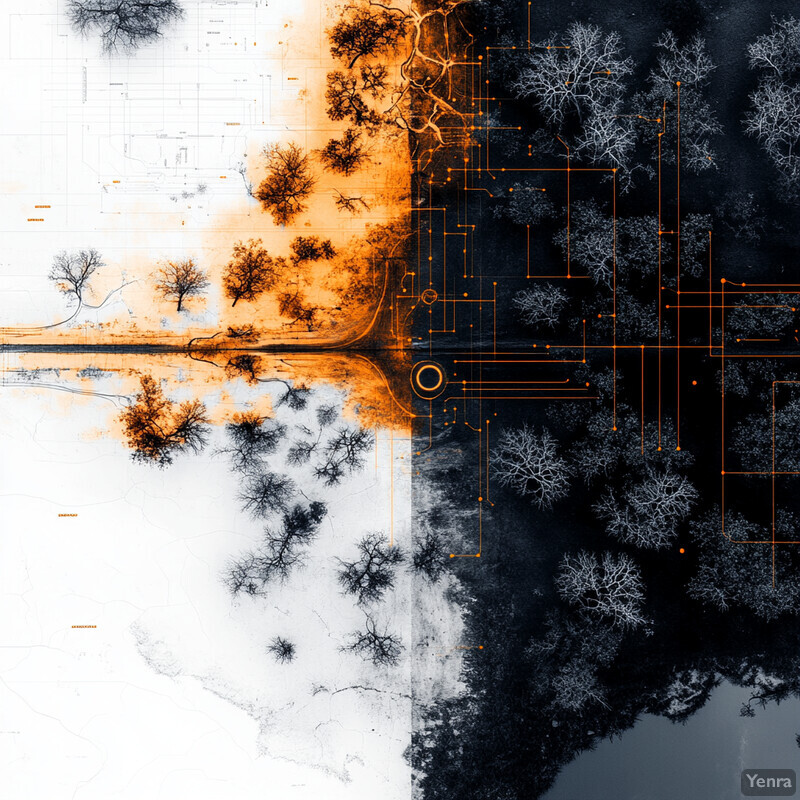
NASA Earth Observatory highlighted how satellite soil-moisture observations can track both deluge and drought, and a 2024 Atmosphere case study used deep learning for flash-drought detection in northeastern Brazil. Inference: agricultural drought AI is strongest when it continuously updates dry-down risk from both moisture and crop-response signals.
11. Enhanced Food Supply Chain Traceability
Satellite traceability is strongest as a plausibility and origin-verification layer, not as a full replacement for chain-of-custody systems. AI can help check whether a farm exists where it says it does, whether land cover and crop signals are consistent with a claim, and whether sourcing falls inside a restricted or high-risk geography.

The European Commission's EUDR implementation work, including the launch of its information system, makes geolocation operational rather than optional for compliance, and ESA's Organic Plausibility Checker is built to verify whether farm claims look consistent with satellite evidence. Inference: the clearest near-term value is not blockchain theater but automated plausibility checks rooted in mapped parcels and repeat imagery.
12. Estimating Carbon Sequestration in Agricultural Lands
AI-based carbon estimation in agriculture is getting better, but the ground truth is that satellites do not directly measure soil carbon. The strongest systems use imagery to estimate management effects, biomass, moisture regime, or land condition, then anchor those signals to soil samples, known practices, and longitudinal measurements.
Recent Scientific Reports papers showed that satellite-driven machine learning can improve soil-organic-carbon estimation for precision farming and that environmental variables materially improve those predictions. Inference: agricultural carbon monitoring from orbit is becoming more operational, but it is still an estimation stack that depends on calibration and audit-quality ground truth.
13. Precision Irrigation Management
Irrigation is one of the clearest areas where satellite agriculture can change daily operations. AI can combine canopy response, evapotranspiration, soil moisture, field boundaries, and weather to recommend when to water, which zone to prioritize, and where to avoid applying scarce water that is unlikely to pay back.
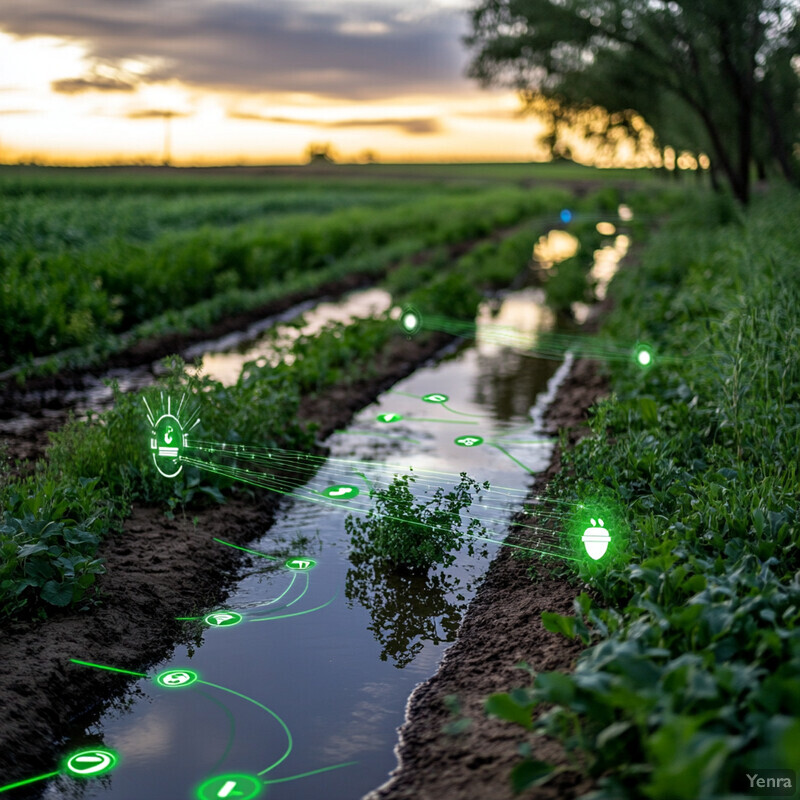
NASA Harvest's partnership with CropX was explicitly aimed at combining satellite and in-field soil-moisture intelligence for more sustainable agriculture, and NASA highlighted Landsat-enabled irrigation support for South Asian farmers. Inference: irrigation AI gets operational when satellite signals are allowed to inform specific watering actions rather than just seasonal summaries.
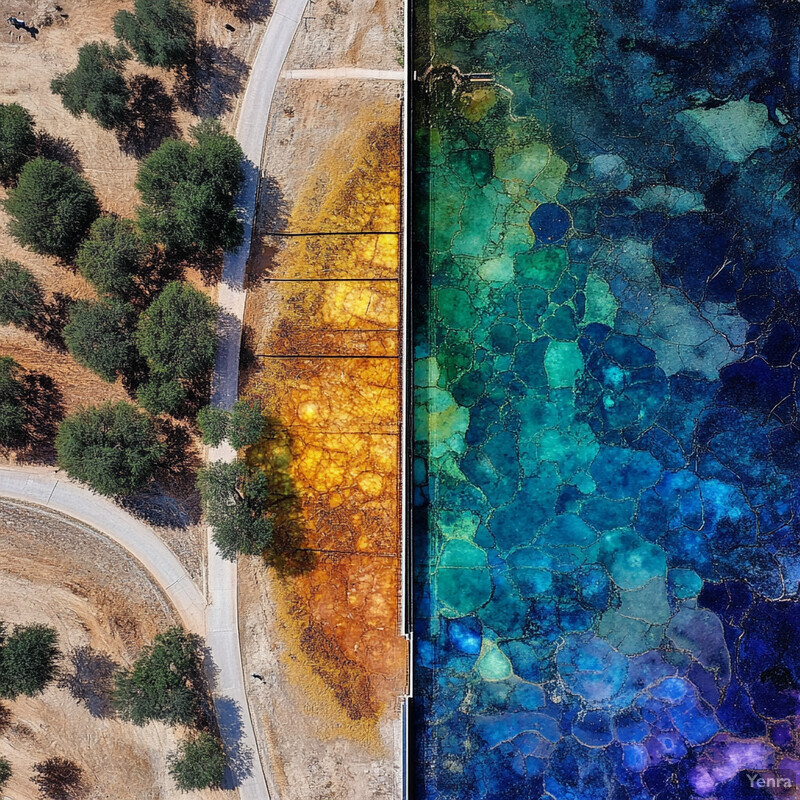
14. Early Detection of Soil Salinity Issues
Salinity mapping is becoming more useful because AI can combine repeated multispectral signals, terrain, and vegetation response to identify which fields are drifting into trouble before yield losses become obvious. This is especially important in irrigated systems where salinity can build gradually and patchily.
A 2025 Remote Sensing study on salinity mapping showed that machine-learning workflows can use satellite data to identify soil salinity patterns at useful resolution. Inference: the practical benefit is earlier field triage and remediation planning, not merely prettier salinity maps.
15. Near-Real-Time Flood Risk Assessment for Fields
Flood assessment for agriculture is increasingly a near-real-time mapping problem. AI helps convert repeated radar and optical observations into field-level inundation estimates quickly enough for triage, claims, replant decisions, and downstream logistics, especially when weather and hydrology are changing faster than manual interpretation can keep up.
A 2025 Nature Communications paper advanced global flood mapping from Earth observation, reinforcing the direction of travel toward faster and broader flood intelligence. Inference: for agriculture, the value is not only knowing that a flood occurred, but locating which parcels were hit and how quickly that map can be turned into operational action.
16. Automated Compliance with Agricultural Regulations
Compliance monitoring is one of the most operationally mature uses of satellite agriculture. AI can compare declared parcels, observed crop patterns, management timing, and buffer-zone behavior against rule sets at scale, reducing how much verification has to rely on manual inspection.
The European Commission's CAP payment management materials describe operational area-monitoring approaches, and the Commission's September 19, 2025 update highlighted satellite technology and smart data as part of Europe's farming future. Inference: agricultural compliance is not a speculative use case anymore; it is a production workflow where AI, parcel boundaries, and repeated imagery already support administrative decisions.
Sources and 2026 References
- NASA ESTO: NASA Agricultural Digital Twin Will Help Farmers Improve Crop Yield Forecasts
- NASA Spinoff: View From the Sky Helps Predict Crop Yields
- NASA Science: Agriculture
- NASA JPL: NASA-ISRO Mission Will Map Farmland From Planting to Harvest
- NASA JPL: Soil Moisture Active Passive (SMAP)
- NASA Earth Observatory: Tracking Deluge and Drought Through Soil Moisture
- NASA: NASA Harvest and CropX Partner to Support Sustainable Agriculture
- NASA Science: South Asian Farmers Fine-Tune When to Water With Landsat
- ESA: WorldCereal Global Crop Monitoring at Field Scale
- ESA Business Applications: CropCloud
- ESA Business Applications: Organic Plausibility Checker
- European Commission: Managing CAP Payments
- European Commission: Satellite tech and smart data take root in Europe's farming future
- European Commission: EU Deforestation Regulation information system launches
- ESSD Preprint: A 10 m annual crop map for maize and soybean across the contiguous United States
- ESSD: A near-real-time global FPAR dataset for cropland monitoring
- ESSD: AI4Boundaries
- Remote Sensing: Estimating root-zone soil moisture by fusing multiple remote sensing products with machine learning
- Frontiers in Sustainable Food Systems: Remote sensing and artificial intelligence in pest management
- Agriculture: Utilizing remote sensing data to ascertain weed infestation levels in maize fields
- Remote Sensing: Estimating potato nitrogen and biomass status from Sentinel-2
- Scientific Reports: Soil total nitrogen estimation using synthetic Sentinel-2 imagery
- Scientific Reports: Soil organic carbon estimation for precision farming
- Scientific Reports: Environmental variables improve soil organic carbon estimation
- Atmosphere: Deep learning for flash drought detection
- Remote Sensing: Soil salinity mapping with remote sensing and machine learning
- Nature Communications: Advances in global flood mapping from Earth observation
Related Yenra Articles
- Precision Agriculture follows the same sensing stack into day-to-day agronomic and equipment decisions.
- Irrigation Scheduling focuses on one of the clearest operational uses for satellite and soil-moisture intelligence.
- Food Supply Chain Traceability extends field-level evidence into origin verification and compliance workflows.
- Land Use Optimization shows how crop maps, parcel boundaries, and geospatial models support broader land decisions.