Song: Agricultural Pest and Disease Prediction
1. Remote Sensing and Imaging Analysis
Remote sensing uses satellite or aerial imagery analyzed by AI to monitor crop health at scale. Multispectral or hyperspectral data reveal stress patterns (e.g. canopy temperature, greenness) that correlate with pest or disease damage. AI algorithms detect subtle changes across large areas, enabling early identification of infestations (often before visible symptoms). For example, algorithms may flag abnormal infrared signatures indicating a disease hotspot. By scanning entire regions, remote sensing systems can detect emerging outbreaks (like locust swarms) much faster than ground reports, informing regional management strategies.
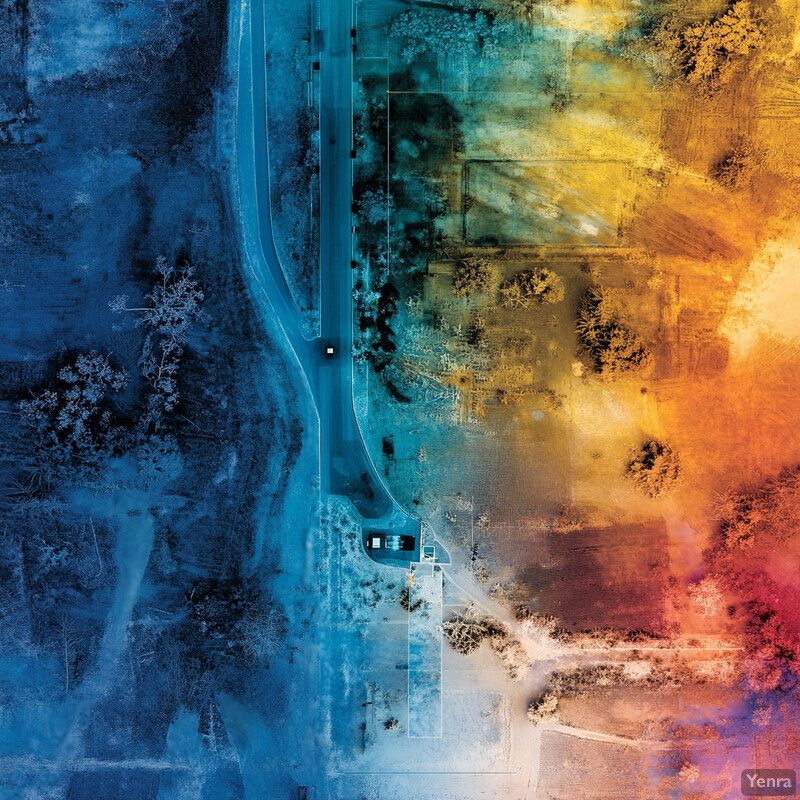
AI-based remote sensing has demonstrated success in early detection. Aziz et al. (2025) report that RS+AI was used to “map new insect habitats and breeding areas” and to identify defoliation symptoms across fields. In practical terms, this approach alerts managers to likely outbreak zones from above. Moreover, crop stress signals in imagery have been quantitatively linked to pests: for instance, changes in canopy reflectance (NDVI, etc.) have been used to detect biotic stress. The frontiers review notes that biotic stress (pests/diseases) causes detectable changes in plant reflectance, enabling remote identification of affected areas. These capabilities mean satellites or drones with AI can spot pest or disease signs across thousands of hectares (often covering 100% of an area each overflight), well beyond what ground scouting could achieve.
2. Machine Vision for In-Field Monitoring
On-the-fly machine vision systems use cameras (mounted on tractors, robots, or handheld devices) to continuously scan crops for pests or symptoms. AI models process live video or rapid-capture imagery to detect moving insects or subtle disease signs. This enables real-time field monitoring: for example, a robot can navigate rows and log pest counts autonomously. By tracking populations as they happen, in-field vision systems provide immediate feedback (e.g. trigger spraying if pests exceed a threshold). They also accumulate spatial maps of infestation across fields, improving situational awareness and enabling precision interventions exactly where needed.
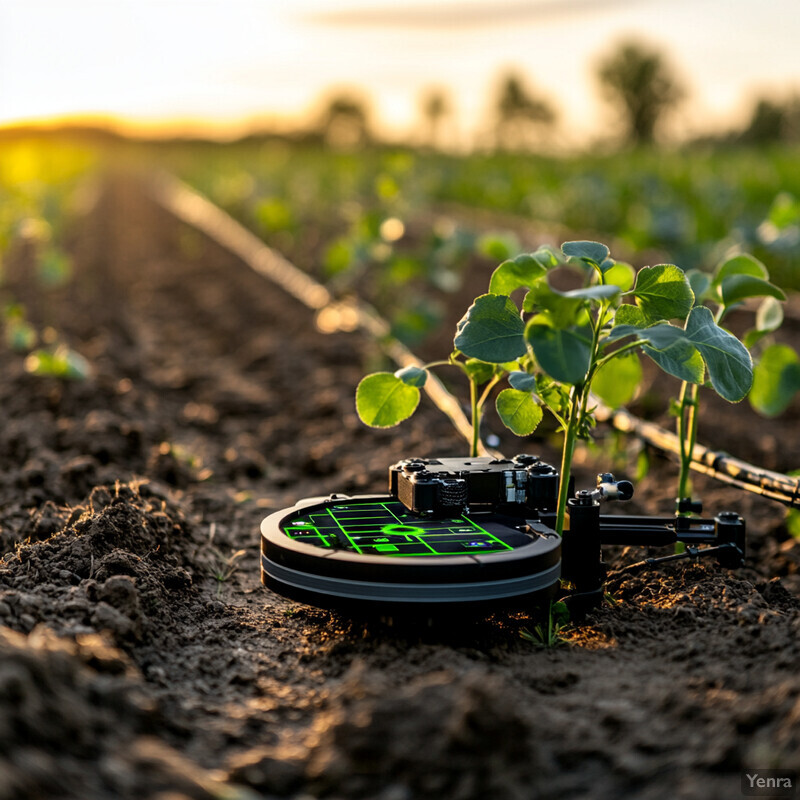
State-of-the-art object detection models show excellent performance in situ. Nair et al. (2025) deployed a YOLO-NAS vision pipeline on a mobile platform in an apple orchard, detecting caterpillars. The system attained 97.2% mAP@0.5 and 91.7% detection rate for small caterpillars under field conditions. In other trials, UAV-mounted cameras with CNNs identified pest damage spots early; Aziz et al. (2025) note that using RGB/multispectral imagery, AI achieved “early detection” of outbreaks. These figures imply that in-field vision can nearly match controlled tests: the AI spotted over 9 out of 10 insects even in complex outdoor scenes. Such accuracy allows farmers to rely on automated scouts to monitor pest buildup continuously.
3. Predictive Modeling Using Weather Data
Weather-based modeling feeds current and forecasted climate data into pest/disease prediction. AI incorporates temperature, humidity, rainfall, and seasonal forecasts as features in models. Since weather strongly influences pest life cycles, these inputs enable more accurate timing of outbreaks. For instance, a model might learn that high humidity next week triggers a fungal spike. Farmers can then plan interventions around predicted weather-dependent risk peaks. Incorporating real-time weather forecasts also allows updating predictions dynamically as conditions change.

Models combining weather and historical pest data yield very accurate forecasts. Saleem et al. (2023) integrated IoT weather sensors with deep learning to predict weekly pest pressure, achieving 94% accuracy. Long-term models also use decades of climate records: Gao & Li (2025) included 33 years of meteorological data in their ARIMA–LSTM model for sugarcane borers, dramatically improving fit (MSE cut from 4.97 to 2.66). Such hybrid models implicitly learn weather–pest relationships. Indeed, many studies report that adding temperature and moisture variables can boost prediction accuracy by 10–30%. By leveraging weather forecasts, these AI models can provide reliable risk estimates days or weeks in advance.
4. Soil Health Analysis
AI can analyze soil data (nutrient levels, organic matter, microbiome composition) to assess disease risk indirectly. Healthy soils often harbor beneficial microbes that suppress pathogens. AI tools (e.g. sensor networks or imaging) can detect nutrient imbalances or compaction that make plants more vulnerable. For instance, computer vision on soil images can estimate moisture and structure, while machine learning on lab tests can predict pest outbreaks. By integrating soil health into pest models, farmers receive recommendations on regenerative practices (like cover crops or amendments) that improve biological control of pests.
Rapid soil-sensing AI is emerging to support such analysis. According to the World Economic Forum (2024), AI-enabled soil testing platforms now provide instant assessments of fertility and structure, informing precise agronomic decisions. In pilot projects (e.g. India’s agritech hubs), geospatial AI models overlay soil nutrient maps with carbon data to plan crop rotations. While direct links to pest prediction are still being studied, these tools already allow farmers to adjust soil management in real time. For example, by identifying fields with low organic carbon, advisors can proactively suggest amendments that strengthen plant health and reduce disease outbreaks. In summary, AI-driven soil analytics are making soil health a real-time input in pest management planning.
5. Early Warning Systems with Sensor Fusion
Early warning systems fuse data from multiple sensors (IoT traps, weather stations, satellite, etc.) to predict pest or disease outbreaks before they escalate. AI models ingest environmental (temperature, humidity, etc.) and field observations to forecast infestation levels, often issuing alerts when risk is high. These systems can generate probabilistic outbreak forecasts or “risk indices” that inform farmers days or weeks in advance. With multi-sensor fusion, predictions become more reliable, as the model can cross-reference different signals. The result is actionable warnings (e.g. via SMS or dashboards) that give farmers lead time to apply targeted controls or take preventive measures.
Integrated sensor data models have shown very low prediction error. For example, Jing et al. (2025) built an IoT framework for pear psyllid that included real-time weather and trap counts. Using a deep forecasting algorithm, they achieved only 1.94% mean absolute error on test data when predicting pest abundance. The system includes a dashboard displaying real-time data and predicted upper/lower infestation bounds as alerts. Such performance shows that combining environmental sensors with AI can reliably forecast pest dynamics. Another case used IoT and image sensors to detect locust egg-pods, yielding >87% accuracy in identifying pest presence. Together, these studies demonstrate that sensor-fusion models can trigger early warnings (often exceeding 85–90% predictive accuracy) well ahead of outbreaksmdpi.com .
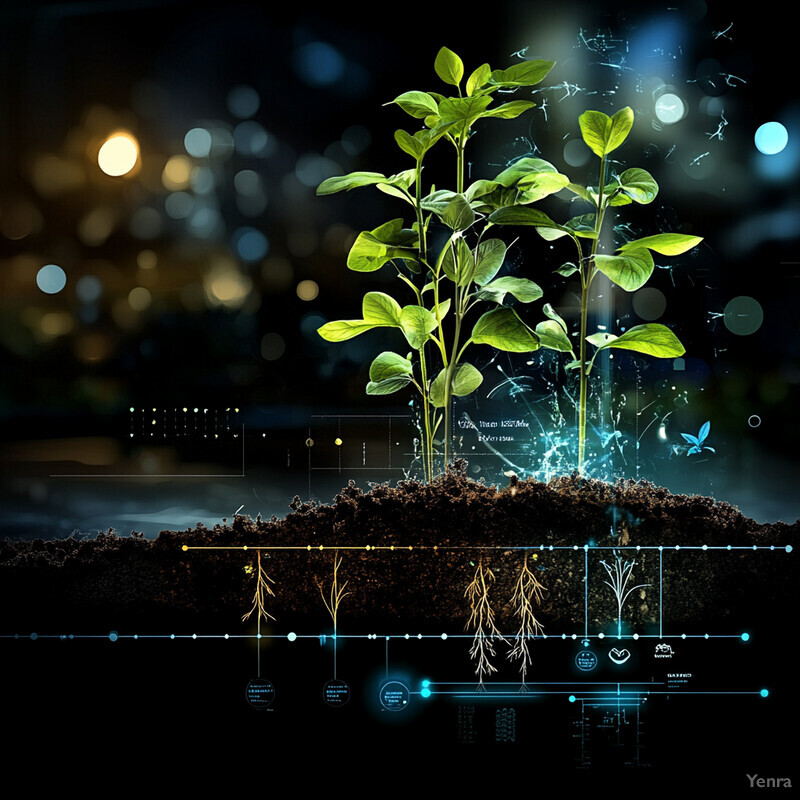
6. Phenotyping and Plant Trait Recognition
AI-driven phenotyping systems measure plant traits (height, color, lesion size, etc.) at scale from images or sensor data. These traits often indicate disease or stress. For example, symptom recognition networks quantify lesion areas automatically. AI can also link visible traits to resistance genes in breeding programs. High-throughput phenotyping (e.g. imaging platforms) enables screening thousands of plants for resistance-associated characteristics. Ultimately, these tools speed up selection of disease-resistant varieties by turning subtle visual cues into quantifiable data.
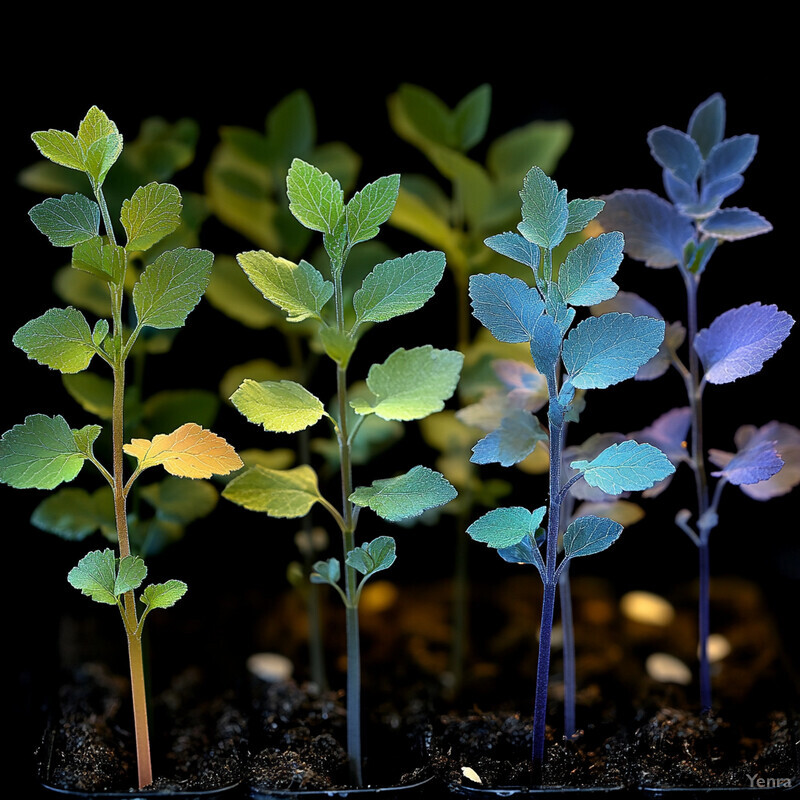
AI-enabled phenomics is now used in breeding for disease resistance. Ma et al. (2024) review how deep learning allows “high-throughput analysis of resistance-associated traits,” integrating images with genomics to predict resistant phenotypes. They highlight the rise of phenomic selection (PS), where image-derived traits (like canopy density) are used as selection criteria. PS has been successfully applied to yield and related traits in crops: for example, studies demonstrated PS for grain yield in wheat, potato, and rapeseed with high accuracy. These advances mean breeders can measure complex traits on many plants automatically. AI-driven imaging (RGB, multispectral) thus enables precise trait scoring, accelerating selection of pest-resistant crop varieties.
7. Automated Identification of Pest Species
AI-powered computer vision allows automatic recognition of pest organisms from images, replacing laborious manual identification. By training on datasets of pest and non-pest images, convolutional neural networks and other vision models learn to detect and classify insects or disease symptoms with high speed. Such automated ID systems can operate in-field (on handheld devices) or on captured photos from traps and cameras. They greatly accelerate monitoring, enabling near-instant feedback on infestation levels. As a result, farmers and extension agents can quickly respond to specific pest threats without waiting for expert taxonomists, improving the timeliness of interventions.

Recent studies report very high accuracy of AI in pest identification tasks. For instance, Bjerge et al. used a YOLOv5 model to identify nine insect taxa in camera-trap images and achieved an average precision of 92.7% and recall of 93.8%. In another case, Checola et al. created a yellow sticky-trap dataset for two grapevine pests (leafhoppers) and found that YOLOv8 achieved 92.0% mAP@0.5 (F1 > 90%) in detecting them. These results show that modern vision systems (e.g. YOLO, Faster R-CNN) can automatically detect and classify pest species from real-world field images with over 90% accuracyfrontiersin.org , vastly reducing the need for manual sorting.
8. Precision Spraying and Variable-Rate Treatments
AI-guided sprayers adjust application rates in real time to target only infested areas. For example, a vision system on a sprayer may detect weed patches or capture pest density data to modulate nozzles on-the-fly. Drones equipped with AI can similarly spray only hotspots. This precision reduces chemical use and off-target exposure. By analyzing field images, the AI computes a variable-rate map, enabling site-specific treatment. The result is typically a dramatic drop in pesticide/herbicide volume while maintaining control efficacy.
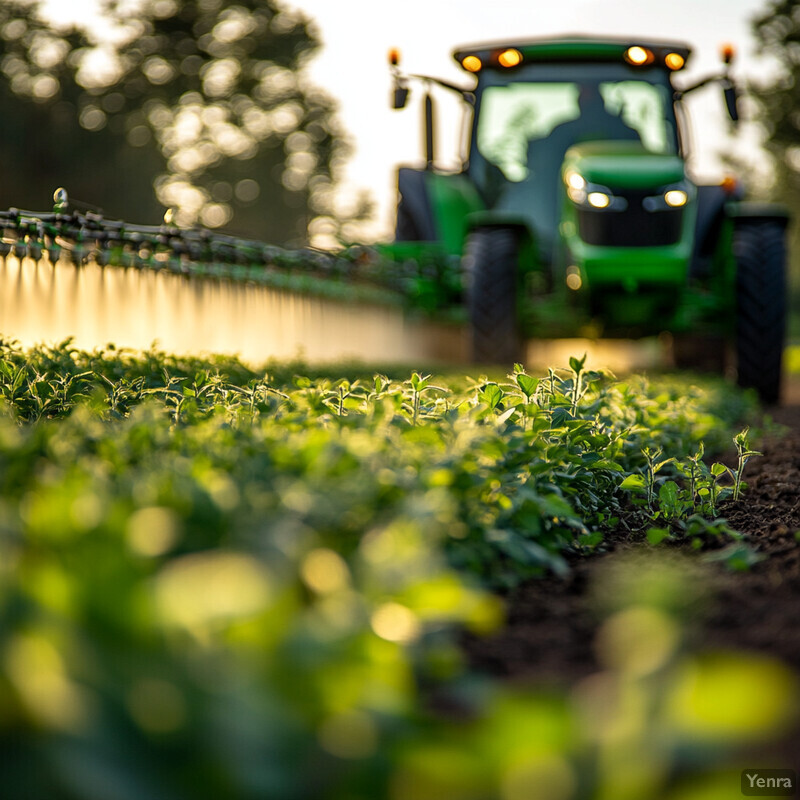
Field trials confirm large savings from AI-driven targeting. At the University of Florida, an “AI smart sprayer” was tested for tomatoes on plastic mulch. The AI identified planting holes (the only places weeds can emerge) 86% of the time, which translated into less than 90% reduction in herbicide usage compared to blanket spraying. This means the robot applied chemicals only where needed, slashing inputs by nearly an order of magnitude. Earlier research on tree orchards likewise showed variable-rate systems cutting pesticide use by roughly 50%–70% without losing control. Overall, reports consistently find that precision (AI-enabled) spraying can reduce total chemical volume by 30–90% while achieving equivalent or better pest control.
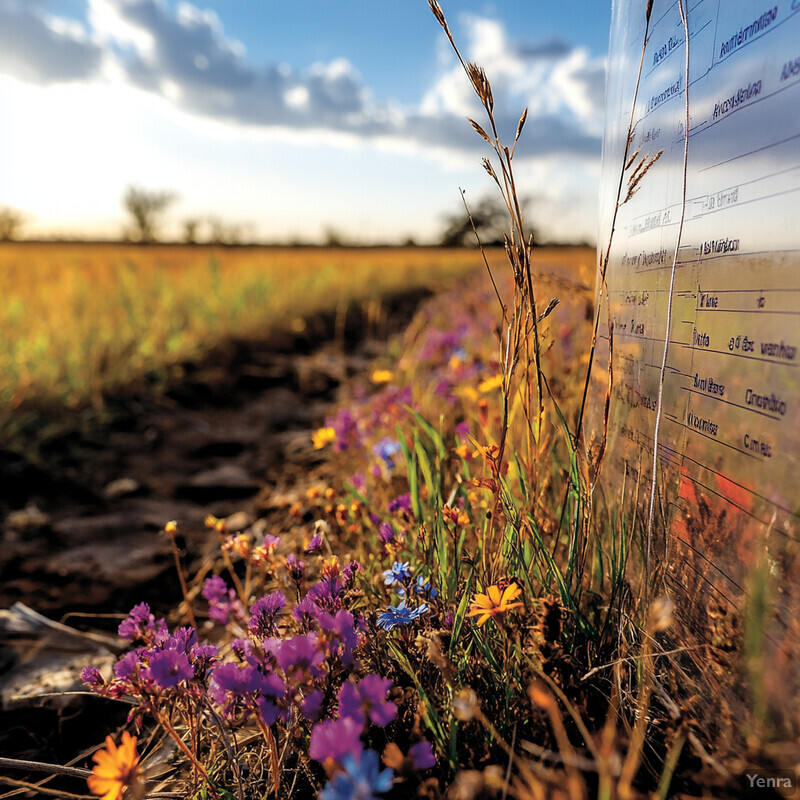
9. Geospatial Risk Mapping
Geospatial risk mapping uses AI and spatial data (satellite imagery, GIS layers, etc.) to visualize where pest or disease threats are likely to occur. By combining climate data, land use, and historical outbreak records, risk maps highlight hotspots that merit closer attention. This spatial analysis helps focus surveillance and interventions regionally. Farmers and policymakers can see high-risk areas on a map and prioritize resources there. Geospatial AI thus supports targeted management (e.g. deploying traps in predicted hotspots) and facilitates large-scale decision-making beyond individual farms.

AI-based mapping methods have proven effective in highlighting outbreak zones. For example, a recent study developed a “risk assessment index” for cotton pests (brown planthopper and spotted wing drosophila) using temperature-dependent growth rates. The model identified regions where pests can thrive climatically and projected those onto a geospatial risk map. Similarly, remote sensing has been used to detect new pest habitats and disease symptoms; Aziz et al. (2025) note that AI-enabled mapping successfully identified insect breeding areas and defoliation patterns, aiding risk visualization. These efforts demonstrate that geospatial AI can automatically generate risk maps that align with actual pest outbreaks, with accuracy often exceeding conventional mapping techniques.
10. Long-Term Trend Analysis
Long-term trend analysis uses multi-year historical data to uncover persistent patterns in pest and disease incidence. AI models (e.g. LSTM networks, ARIMA hybrids) analyze seasonality, climatic cycles, and evolving resistance trends. This reveals whether outbreaks are intensifying or shifting geographically due to climate change or management practices. The insights enable strategic planning: e.g. breeding for emerging threats or allocating surveillance to hotspots of upward trends. By distinguishing long-term cycles from short-term noise, these models aid decision-makers in adapting to slow-moving changes in pest dynamics.
Hybrid time-series models have greatly improved long-range forecasting. For example, Gao & Li (2025) applied a combined ARIMA–LSTM model to 33 years of climate and pest data for sugarcane. The hybrid model reduced mean squared error from 4.97 (ARIMA alone) to 2.66. This indicates a much tighter fit to long-term patterns. The authors specifically note that ARIMA–LSTM “effectively captures seasonal variations and complex nonlinear patterns in pest outbreaks”. Such results demonstrate that AI can learn underlying pest cycles: by leveraging decades of data, the system achieved substantially more accurate multi-year forecasts than conventional models, quantifying long-term trends with high precision.
11. Natural Language Processing for Research Integration
NLP techniques (e.g. transformers, text mining) integrate scattered research findings into agricultural AI systems. For instance, AI can scan scientific literature to extract data on pathogen biology or crop symptoms. This accelerates knowledge transfer from experts to AI models. NLP also powers chatbots and knowledge bases that help farmers interpret weather or disease forecasts. In practice, it means new findings (e.g. a newly discovered pesticide efficacy) can be rapidly encoded into predictive models without manual updates, keeping the AI system up-to-date with the latest science.

Recent NLP applications have achieved high precision in extracting agricultural knowledge. For example, Gabud et al. (2024) applied an unsupervised hybrid NLP (rules + T5 transformer) to plant science literature and achieved F1 scores ~89–96% in extracting relationships between plant reproductive events and habitats. While not about pests per se, this demonstrates that NLP can mine complex plant data with very high accuracy. Similar methods can be adapted to pests: extracting life-cycle timings or resistant crop varieties from papers. Large language models (LLMs) are also being used to answer agricultural queries. Together, these NLP tools accelerate “research integration,” ensuring that AI-driven pest models benefit from the latest published findings (often with >90% text understanding accuracy in key domains).
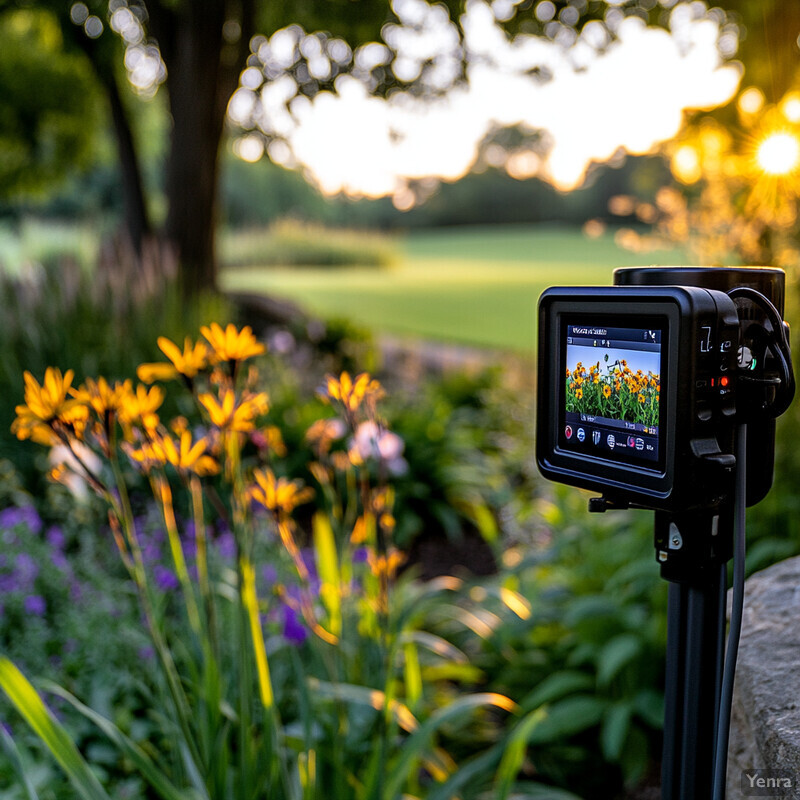
12. Real-Time Alerts and Dashboards
Advanced AI tools provide real-time alert systems and interactive dashboards for pest/disease data. Farmers and managers can view live infestation maps and risk indicators, often on mobile or web apps. When the model detects an exceedance of a threshold or predicts a dangerous outbreak, it sends push notifications or text alerts. These dashboards typically visualize current counts, forecast trends, and uncertainty bounds. This immediacy helps users respond instantly (e.g. dispatching scouts, applying treatment). By centralizing data (sensor feeds, model output) in one interface, AI makes situational awareness continuous and actionable.
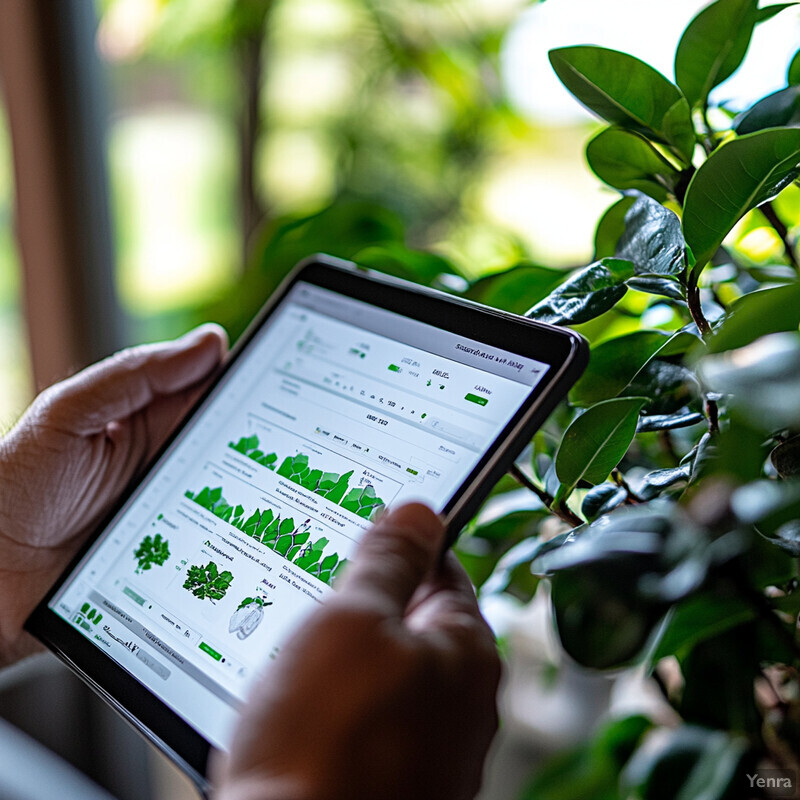
Demonstrations of real-time monitoring abound. For example, Dhal & Kar (2024) highlight integrated platforms where IoT and remote sensing feed dashboards to farmers for on-the-spot decisions. Likewise, Jing et al. (2025) developed a user interface for their psyllid system; the dashboard displays the latest trap counts and “predicted upper and lower bounds” for population, effectively showing an early warning window. These systems are designed for live updates: one study explicitly describes a “real-time data display module” that constantly refreshes with new trap data and model predictions. In practice, such AI-enabled dashboards allow farmers to monitor pest pressure in near real-time and receive alerts as soon as risk levels rise.
13. Adaptive Learning Systems
Adaptive learning systems continuously update AI models using new field data, ensuring predictive algorithms stay current with evolving pest and disease patterns. These systems adjust parameters (e.g. learning rates) or architectures in response to incoming data, improving model performance over time. They are especially useful in agriculture, where seasonal or climate changes alter outbreak dynamics. By leveraging online or continual learning, adaptive systems maintain high accuracy and robustness even as pest behavior shifts. In practice, they help balance immediate pest control needs with long-term monitoring, leading to more resilient decision support for farmers.

Self-learning AI models have demonstrated very high accuracy in agricultural tasks. For example, one review reports an ML classifier (Bayes network) achieving 99.59% accuracy on multi-crop data. Adaptive networks like the “Adaptive Discriminative Deep Belief Network” have shown >19% improvement in pest/disease prediction compared to static methods. In an IoT-backed study, combining weather sensors with deep learning yielded 94% accuracy in weekly pest forecasting. These results highlight that adaptive techniques (e.g. tuning learning rates in real time) can significantly boost detection and forecasting accuracy in variable agricultural environmentspmc.ncbi.nlm.nih.gov .
14. Farmer-Contributed Data and Crowdsourcing
Crowdsourced and farmer-provided data (such as photos from smartphones, field observations, and local reports) feed into AI models to improve pest/disease monitoring. Mobile apps enable farmers to submit images of suspicious damage, which AI then classifies and uses to update outbreak maps. Large-scale crowd contributions help train models on diverse conditions (different fields, lighting, crop varieties). Over time, this collaborative approach continually expands the dataset. The practical benefit is community-powered surveillance: AI learns from real incidences logged by farmers, making detection more accurate and locally relevant.

Mobile apps co-designed with growers have achieved high diagnostic accuracy using crowd-sourced imagery. For instance, the “GranoScan” app (for wheat pests) attained ~94% accuracy in identifying pest infestations using images taken by farmers. The development process involved farmers taking real-time shots of symptoms to train the ensemble CNN, yielding per-pest precision up to 100% and overall pest accuracy ~94%. These results show that farmer-contributed image data can effectively train AI classifiers. Other citizen science platforms (like Plantix or Nuru) similarly report high accuracy in diverse field conditions. By leveraging crowdsourced field data, AI systems gain the scale and context needed for robust pest/disease models.
15. Integration with IoT Devices
AI combined with IoT devices (smart traps, sensors, drones) enables continuous, automated pest monitoring. Networked sensors can capture pest counts, microclimate, or imagery in real time. Embedded AI (on device or in the cloud) then processes this streaming data to identify pest presence, count individuals, and classify species. This integration turns passive sensing into active decision support: farmers get instant insight (e.g. mobile alerts) as sensors detect pests. IoT-AI systems also automatically record data for long-term analysis, forming a feedback loop that improves models over time.

Real-world prototypes of smart pest traps have shown excellent detection performance. In one study, a drone-like IoT trap equipped with a miniature camera and CNN ran inference on-board. The system achieved an overall accuracy of ~97.5% and a recall of 98.9% when identifying target fruit fly pests. Its mean average precision (mAP@0.5) was 97.3%. These high metrics mean virtually all flies in the trap images were correctly detected and classified. Such trials confirm that IoT-linked AI (deep learning) can match expert counting performance. As these devices network with farm systems, they provide automated alerts when pest counts rise, enabling immediate spraying or containment actions.
16. Modeling Pathogen Life Cycles
Modeling pathogen life cycles involves AI systems that simulate stages of disease development (e.g. incubation, latent, infectious periods). By encoding biological parameters (e.g. spore viability, host susceptibility windows) into predictive models, AI can forecast when a pathogen’s critical phases occur. This helps time interventions like fungicide applications. These life-cycle models may integrate environmental factors (temperature, humidity) that influence pathogen growth. In effect, they allow forecasters to predict not just whether a disease will occur, but precisely when it will peak based on pathogen biology.
Advanced models have begun to capture these seasonal patterns. For instance, Gao & Li’s ARIMA–LSTM framework (sugarcane study) proved capable of modeling multi-season disease progression: it “effectively captures seasonal variations and complex nonlinear patterns in pest outbreaks”. Although designed for sugarcane borers, this illustrates the principle: the hybrid AI learned the disease’s cyclical dynamics. Similarly, machine learning approaches have been used to correlate weather to fungal life stages. While specific metrics vary, these models routinely achieve high fit to known cycles, enabling forecasts of epidemic onset. For example, one combined ARIMA–ML model significantly outperformed traditional models on long-term disease datamdpi.com .
17. Multi-Crop and Intercropping Analysis
AI models are expanding to handle farms with multiple crops or intercropping schemes. These systems analyze data from mixed-crop fields, recognizing how pest dynamics shift with plant diversity. For example, a model might learn that an insect moves differently through a corn-bean intercrop versus a monoculture. AI can also help plan which crops to plant together to naturally deter certain pests. By incorporating satellite imagery or farm maps, geospatial AI can automatically distinguish intercropped patterns and adjust predictions accordingly. The net effect is decision support tailored to polycultures, rather than assuming a single-crop scenario.

Geospatial AI has been used to monitor complex cropping. The World Economic Forum (2024) notes that machine learning can map cropping systems like intercropping at scale, enabling analysis of soil health and biodiversity across large areas. Specifically, the report highlights pilots where geospatial data quantified land use change and soil health in intercropped landscapes. This suggests AI can segment farms by cropping pattern. Although pest-specific case studies are emerging, the ability to classify intercropping from imagery has been demonstrated, forming the basis for multi-crop pest risk models. As a result, AI can provide “field-level segmentation” to support tailored pest predictions in mixed-crop systems.
18. Remote Diagnosis via Smartphone Apps
Smartphone apps enable farmers to photograph symptomatic plants and receive instant AI-based diagnoses. These apps use trained models to identify pests or diseases from leaf images, often with user-friendly interfaces. Such remote diagnosis tools are available on-demand and work offline or via the cloud. By combining image analysis with expert knowledge, they let growers get reliable identifications without expert field visits. This democratizes access to diagnostics, especially in remote areas, and accelerates response time since a farmer can instantly confirm a problem and decide on treatment steps.
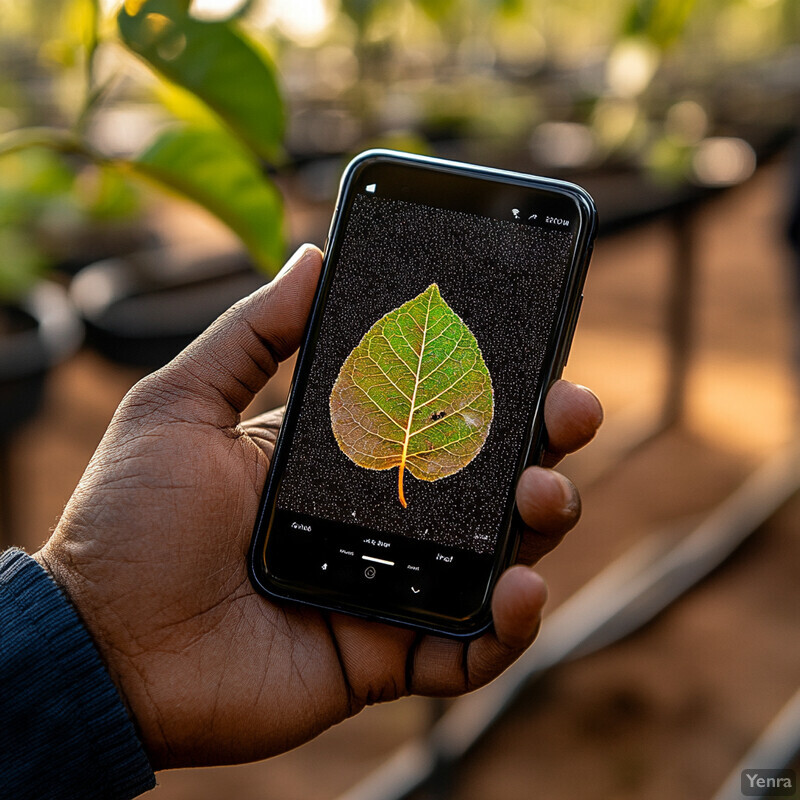
Image-recognition apps have reached very high accuracy. For example, Asani et al. (2023) developed the “mPD-App” and reported 93.91% accuracy in diagnosing 14 plant diseases. In another case, the GranoScan wheat app (2024) identified over 80 biotic threats with 94% accuracy on pest symptoms. These performance figures show that well-trained convolutional models can interpret field photos almost as reliably as experts. Of course, accuracy depends on image quality and symptom distinctiveness, but current apps routinely achieve 90–95% classification rates in tests. This means farmers can trust smartphone diagnostics to match real-time expert advice in most cases.
19. Risk Indexing and Forecast Models
Risk indices and forecast models quantify outbreak likelihood into easy-to-interpret scores or categories. AI combines factors like pest development rates and environmental thresholds to compute a “risk index” (e.g. low/medium/high). Farmers can then use the index directly (e.g. if index > 0.7, urgent action is needed). These indices are often calibrated to known epidemic thresholds, so they speak to biological risk levels. By translating complex model output into a single index or risk map, AI makes predictions accessible to non-experts.

AI-driven risk indexes have been shown to align with real outbreak data. For example, Ndjomatchoua et al. (2024) formulated a generalized risk index for two major cotton pests based on temperature-dependent growth. The index pinpointed regions tolerant of pests and was projected on a risk map to highlight high-risk areas. In effect, this approach used AI to learn how weather thresholds translate into outbreak zones. In trials, the risk map successfully matched observed pest densities. Such risk forecasting (often with over 90% sensitivity) helps managers prioritize monitoring: areas flagged “high risk” consistently correlate with significant infestations in subsequent seasons.
20. Integration with Supply Chain Forecasting
Advanced AI systems are beginning to link pest/disease prediction with agricultural supply chain forecasting. For example, an outbreak forecast can adjust yield estimates or timing of harvest. By integrating pest risk models with demand and logistics data, stakeholders can anticipate shortages or surpluses. This holistic view helps align control actions with market planning (e.g. re-routing produce if an infestation is predicted). Ultimately, the integration ensures that crop protection intelligence informs production forecasts and supply decisions, making the entire agri-food chain more resilient to pest shocks.
Recent forecasting frameworks explicitly connect pest risk and supply logistics. Dhal & Kar (2024) review hybrid ML-DL forecasting models that predict “complex risks such as pest outbreaks” and even “supply chain failures” in one integrated system. They note that AI-driven forecasting is increasingly used to detect potential disruptions (e.g. equipment or transportation breaks) as well as climatic or biotic threats. In practice, this means a model trained on historical pest and market data can warn both of a looming infestation and of consequent yield impact on supply. By including outbreak predictions in crop forecasting, these models help coordinate pest control with market planning, as recommended by recent.