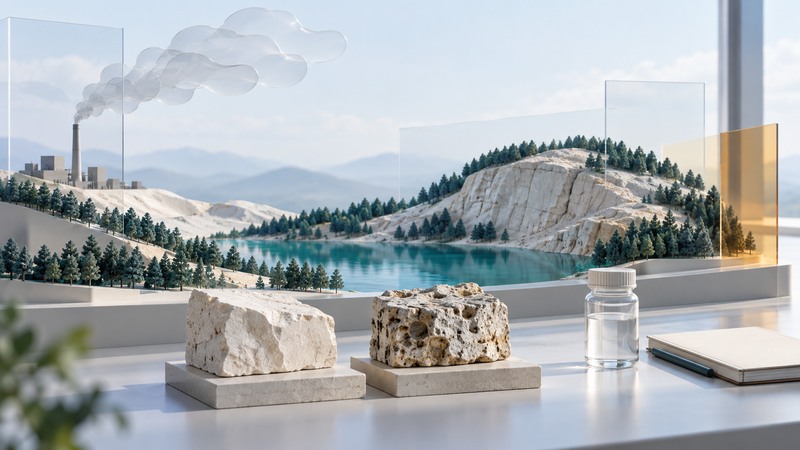
Acid rain is part of acid deposition: acidic substances reach the surface in precipitation and through dry deposition. Pictures can help explain the process and document a place. Identifying the cause and extent of damage requires chemical, environmental and historical evidence.
This guide is for students and readers interpreting an image or monitoring result. Start by identifying whether the image is a conceptual illustration, a documented photograph or a visualization of measured data. Each supports a different kind of statement.
Follow emissions, transport and deposition
EPA’s explanation of acid rain describes how sulfur dioxide and nitrogen oxides can react in the atmosphere to form acidic compounds. Winds transport pollutants, so the receiving ecosystem can be far from the source.
Wet deposition includes rain, snow and fog. Dry deposition places gases and particles on surfaces; later rainfall can wash accumulated material into soils and water. A photograph of rain captures neither the complete deposition load nor its chemical composition.
On a narrow screen, scroll the table sideways. Keyboard users can focus it and use the arrow keys.
| Image type | Useful information | Evidence still needed |
|---|---|---|
| Conceptual illustration | The stages or relationships being explained. | Measurements for any real place or numerical claim. |
| Dated site photograph | Visible condition and location at that time. | Material, history and other possible causes. |
| Repeated photographs | Documented visible change under comparable views. | Consistent conditions and relevant measurements. |
| Monitoring map | A defined measurement or estimate over an area. | Legend, method, period, coverage and uncertainty. |
Read the pH scale correctly
EPA’s measurement overview explains that lower pH indicates greater acidity and that rain can be naturally mildly acidic. The scale is logarithmic: a one-unit difference corresponds to a tenfold difference in hydrogen-ion activity.
For actual monitoring, record the method, sampling period, instrument checks and relevant quality flags. Avoid combining pH observations by casually averaging the numbers; use the analysis method specified by the monitoring program.
Connect a possible effect to its setting
EPA’s effects overview describes acidification, mobilization of aluminum and losses of soil nutrients. Susceptibility depends on the ecosystem and its buffering capacity. The same deposition can have different consequences in soils with different properties.
Acidic deposition can accelerate deterioration of some materials. A weathered statue or stained wall may also reflect moisture, salts, biological growth, abrasion or maintenance history. Record the visible condition first, then seek appropriate conservation or material assessment before assigning a cause.
For lakes and forests, examine more than a dramatic photograph. Chemistry, species responses, soils, precipitation and the length of the record help explain change. An image of clear water provides little evidence about acidity.
Use a monitoring record to investigate change
The National Atmospheric Deposition Program’s National Trends Network provides wet-deposition measurements. Choose a site and period, then read collection methods and data-quality information. Wet-deposition records answer a more specific question than total atmospheric deposition.
Distinguish concentration from deposited amount. Rainfall amount and chemistry together influence wet deposition; a dilute wet year and a concentrated dry year cannot be ranked by concentration alone. Compare equivalent periods and retain information about missing or invalid samples.
Recovery also needs a stated metric. Declining deposition, changing lake chemistry and recovering biological communities need not move at the same rate. Use a long enough record to distinguish a sustained change from weather-driven variation.
Create a defensible image-and-evidence record
Keep the image source, date, location, direction of view and any edits. Label illustrations explicitly and retain original photographs. Write observations separately from explanations and list the evidence that would help resolve the question.
For a field observation, stay in a safe, permitted location and follow qualified sampling guidance if measurements are needed. The water-picture guide provides a reporting record, while the AQI guide addresses current outdoor air-quality decisions.
Acid deposition image and evidence sheet
Acid deposition image and evidence sheet — plain-text download. Save a copy and fill it in with your own information. It includes instructions, example assumptions and source references.