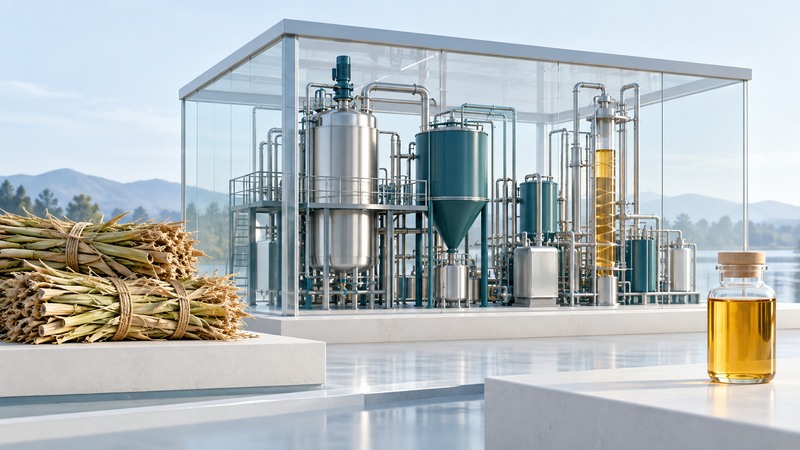
To evaluate a low-cost cellulosic biofuel claim, identify the fuel, feedstock, process and production scale, then ask how much saleable fuel is produced from a defined quantity of feedstock over a sustained operating period. Cost per litre depends on that denominator as much as on any single process improvement.
This guide uses biochemical cellulosic ethanol as its main example. Other fuels and conversion pathways need their own yields, product specifications and energy balances.
Locate the claimed improvement in the process
Cellulosic feedstocks include crop residues, wood residues and dedicated energy crops. The U.S. Alternative Fuels Data Center’s ethanol-production overview describes biochemical and thermochemical routes. In a biochemical route, preparation and pretreatment make plant material more accessible, enzymes release sugars, fermentation produces ethanol and separation recovers the product.
A lower enzyme cost or a higher laboratory sugar yield addresses one part of that chain. Ask what changes elsewhere: chemical use, inhibition of fermentation, water demand, recovery energy, waste treatment or maintenance. Request an integrated mass and energy balance at the claimed operating conditions.
On a narrow screen, scroll the table sideways. Keyboard users can focus the table region and use the arrow keys.
| Input | Define it explicitly | Evidence to request |
|---|---|---|
| Feedstock | Type, moisture, dry-mass basis and delivered boundary | Representative composition, supply and handling assumptions. |
| Yield | Saleable product per dry tonne, with specification | Measured integrated runs and how losses are counted. |
| Utilization | Operating days or hours at a defined throughput | Downtime, startup, maintenance and off-spec production records. |
| Cost | Currency year, location, plant scale and included costs | Itemized capital/operating assumptions and sensitivity results. |
| Credits | Coproduct revenue, policy support and other offsets | Eligibility, prices, quantities and scenarios without the credit. |
See how yield and utilization change the denominator
Fictional production and cost components
A plant processes 100 dry tonnes per operating day at 250 L of saleable ethanol per dry tonne. At 300 operating days, annual output is 7.5 million L. At 200 days, it is 5 million L.
If annual fixed cost is an invented US$3 million, the fixed-cost component rises from $0.40/L to $0.60/L. This excludes feedstock and other variable costs. With an invented delivered feedstock price of $80 per dry tonne, feedstock contributes $0.32/L at 250 L/tonne, or $0.40/L if yield falls to 200 L/tonne.
All prices and operating inputs are fictional. These component calculations are not a complete production cost or current quotation.
Use dry tonnes consistently. A wet delivered tonne contains water as well as biomass. Ask whether the quoted delivery price and yield use the same moisture basis before dividing one by the other.
Separate a design model from operating evidence
The May 2011 NREL corn-stover ethanol design report is a detailed example of a techno-economic model. It uses a defined process, target performance, an established-plant assumption and 2007 dollars. Its modeled selling price belongs to those assumptions, not to a current market quote.
Label evidence by scale and duration: laboratory conversion, pilot operation, demonstration runs or sustained commercial production. Ask whether the reported yield covers the complete process and whether the run included normal feedstock variation, startup losses and maintenance.
For a forecast, request the bridge from measured conditions to the proposed plant: equipment scale-up, throughput, recovery performance, utilities and uptime. A grant, partnership or construction announcement establishes a project milestone; production and cost claims need their own operating evidence.
Build a comparison that survives changed assumptions
Prepare a base case and less-favorable cases for delivered feedstock, yield, utilization, energy use and coproduct revenue. Change one input at a time to identify what drives the result, then test plausible combinations. Keep financing assumptions separate from physical conversion performance so their effects remain visible.
When a claim omits the cost year or currency, request them before comparing figures. When a low cost depends on high uptime, ask for the operating record that supports it. When credits dominate the result, show the gross production cost and credit assumptions separately.
The completed review should state the exact product and boundary, the strongest measured evidence, the assumptions needed to reach the claimed scale and the variables that could reverse the conclusion. The worksheet below provides a place to record those items without turning an announcement into an unsupported cost forecast.
Cellulosic cost-claim review
Cellulosic cost-claim review — plain-text download. Save a copy and fill it in with your own information. The file includes instructions, assumptions and references so it can be used independently.