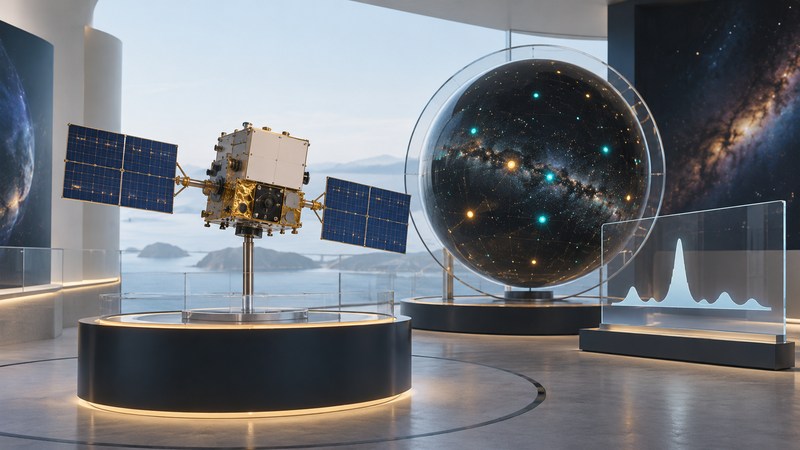
Fermi reveals a sky of energetic particles, variable sources and brief outbursts. To interpret one of its results, identify the instrument, the energy band and the time interval before reading the brightest point or largest flare. A sky map, a catalog entry and a burst alert are different products, each with its own uncertainty.
Start with LAT or GBM
NASA's mission overview describes Fermi's two complementary instruments. The Large Area Telescope (LAT) reconstructs gamma-ray events and supports imaging, source catalogs and monitoring. The Gamma-ray Burst Monitor (GBM) uses detectors facing different directions to measure rapid changes and estimate burst locations across a broad visible sky.
| Question | Useful starting product | Keep attached |
|---|---|---|
| Where are persistent or recurrent sources? | LAT catalog and associated maps. | Release, energy range, integrated dates and localization. |
| How did a known source vary? | LAT light curve. | Time-bin width, flux units, fit quality and upper limits. |
| What happened during a burst? | GBM or LAT burst record, as applicable. | Trigger time, detector/band, duration and revised position. |
| Can I reproduce a measurement? | Event data and official analysis documentation. | Selections, exposure, response and background model. |
The Fermi data-products directory is the durable starting point for these services. Choose a prepared product for a first reading; quantitative reanalysis of event data requires instrument-specific methods.
Read a catalog entry with its release notes
Use the 4FGL-DR4 catalog as a dated example. It combines 14 years of LAT data from August 2008 to August 2022 over 50 MeV–1 TeV. A source detected in that integrated dataset can be faint in a short interval.
- Record the complete 4FGL identifier and release. A familiar counterpart name is useful, but the catalog identifier preserves the exact entry.
- Read the position and localization uncertainty together. Nearby objects may share the same broad error region.
- Inspect the association, classification and quality flags. DR4 distinguishes statistically supported associations from firm identifications; its documentation explains the classification conventions.
- Check whether the source was modeled as extended or point-like and which spectral form was fitted. These choices influence derived fluxes.
A nonzero quality flag deserves attention to the documented issue, such as source confusion or imperfect diffuse-emission modeling. Save the release notes beside a copied row so the caution travels with the numbers.
Try a light-curve reading exercise
Open the LAT Light Curve Repository and select a variable source from its map or catalog list. Read its identifier and association before opening the source report. The repository covers a selected variable-source sample; a missing entry is not a statement that the object emits no gamma rays.
Choose one time range and compare the available three-day, weekly and monthly views. Keep the energy range and fitted quantity fixed. A short peak can be diluted by a longer bin; short bins also have fewer photons and often larger relative uncertainties. Record the time-axis convention rather than assuming every number is a calendar date.
The usage notes explain fit-quality filters, upper limits and possible exposure-related outliers. Use the default quality filtering for an initial inspection. Automated results are released without individual LAT collaboration validation, so an isolated spike should lead to a check of uncertainties, fit status and neighboring sources.
Read a burst alert as a developing measurement
GBM compares responses across its detectors to estimate a burst's direction; see the GBM instrument description. Follow-up observations can refine an initial location. Preserve the trigger ID, event time, notice revision and localization region rather than copying only a central coordinate.
A burst duration depends on the band and measurement definition. An upper limit means a measurement constrains a signal under stated assumptions; it is not a zero-flux point. These distinctions also matter when comparing gamma rays with a neutrino alert or studying a microquasar across wavelengths.