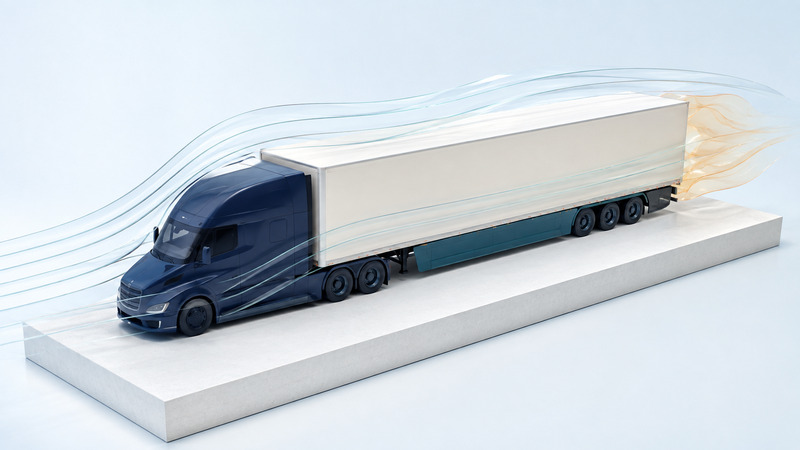
An aerodynamic truck uses less energy to push air aside. For an owner or fleet manager, the useful question is how much fuel a particular tractor-and-trailer combination can save on the work it actually does—and whether that saving survives installation costs, damage, maintenance and changes of trailer.
Start with the vehicle as a system. A streamlined cab, a trailer of a different height, an open tractor–trailer gap and a damaged skirt interact with one another. A product photograph or a drag-reduction percentage is not enough to predict annual operating cost.
Look at the whole airflow path
Air changes direction around the nose, windshield, roof and mirrors, passes the gap between tractor and trailer, encounters the underbody and wheels, and leaves a disturbed wake behind the trailer. Improving one area does not make the others irrelevant. The shape that works for a highway box trailer may not suit a tanker, flatbed or local delivery vehicle.
On a narrow screen, scroll the table horizontally. Keyboard users can focus the table region and use the arrow keys.
| Area | Purpose | Check before buying |
|---|---|---|
| Cab roof and trailer front | Manage the transition from tractor to trailer. | Trailer height, roof-fairing adjustment, cooling needs and the manufacturer’s setup instructions. |
| Tractor–trailer gap | Limit disturbed flow in the space between vehicles. | Turning clearance, hoses, refrigeration equipment and the actual tractor pairing. |
| Trailer underside | Use skirts or another tested arrangement to manage underbody flow. | Dock approaches, ground clearance, inspection access and repairability. |
| Trailer rear | Reduce the drag associated with the wake. | Door operation, loading facilities, deployment, lighting visibility and damage exposure. |
The EPA explanation of aerodynamic device types distinguishes skirts, tails, gap reducers and other under-trailer treatments. It also identifies combinations that are unsuitable or require additional testing. Treat a package as a tested configuration; do not add the advertised savings of separate devices together.
Aerodynamic resistance becomes particularly significant in highway operation. A truck spending much of its day stopped, maneuvering or working at low speed presents a different opportunity. EPA’s overview of improved truck aerodynamics explains the highway context. That older overview is useful background, rather than a source of current product recommendations.
Separate drag, fuel consumption and miles per gallon
Drag is a force; fuel consumption pays for aerodynamic resistance along with rolling resistance, climbing, acceleration, engine and drivetrain losses, and auxiliary loads. An 8% reduction in aerodynamic drag therefore does not automatically reduce total fuel consumption by 8%.
Fuel savings and MPG improvement also use different denominators. If a vehicle travels the same distance using 5% fewer gallons, its MPG rises by 1 ÷ 0.95 − 1, or approximately 5.26%. Keep the metric explicit when comparing a sales presentation with your own records.
The SmartWay verified aerodynamic-device list identifies products and combinations for 53-foot dry-van and refrigerated trailers, together with their savings category and test information. Confirm the exact model and installation arrangement. A listing for that trailer class is not a universal claim for every truck body, speed or route.
Ask for the supporting verification letter and test conditions: tractor geometry, trailer configuration, operating speed and how the baseline was established. Wind-tunnel, coastdown and track results measure different things. EPA describes CFD simulation as a supplemental verification method, so attractive simulated airflow images alone are not a substitute for the required testing.
Make a comparison that can survive scrutiny
A before-and-after fuel receipt can be dominated by weather, loading, traffic or a changed driver. A better fleet trial records those influences and compares like work. Define the intended route and vehicle population before collecting the result, and record failures as carefully as successful runs.
- Identify the tractor, trailer and device configuration. Photograph installation condition and record any changes.
- Choose comparable routes, loads and speed policies. Record distance, fuel, idle time, driver, weather and unusual delays.
- Use a consistent measurement method. Repeated matched runs or a suitable comparison vehicle help reveal variation.
- Repeat after repairs or configuration changes. Keep results for different trailer types separate.
- Compare gallons per distance over the full trial. Report the number of runs, the spread of results and what remains uncontrolled.
For mixed loads, also consider fuel per unit of freight moved. A device that reduces payload or creates loading delays can change the business result even when it reduces fuel per mile. Do not average trip MPG values without considering distance and fuel: total miles divided by total gallons is the aggregate MPG.
AI can help categorize maintenance notes or flag missing trial fields, with a person checking the underlying records. It should not convert an uncontrolled comparison into a confident causal claim. Keep the original measurements available for review.
Worked example: a modest saving with explicit assumptions
At only 2% fuel reduction, the same case yields $1,080 net per year and about 2.78 years’ simple payback. At zero fuel reduction, maintenance is an additional cost and there is no fuel-saving payback. These calculations exclude finance, tax, downtime, resale value and changes in fuel prices or mileage.
Download the worked calculation and blank fleet-trial record. Use your measured or defensibly estimated savings range, and include the cost of keeping the equipment in the tested condition.
Buy for the route and keep the configuration intact
Before committing, ask who will inspect the equipment, how quickly damaged parts can be replaced, whether drivers must deploy a device, and how often the trailer will run behind a different tractor. A small consistent benefit can be more valuable than a larger claimed benefit that depends on an arrangement the fleet rarely uses.
Choose a supported installation, run a documented trial, and revisit the economics when the duty cycle changes. Record both fuel use and operational inconvenience so the decision reflects the whole job.