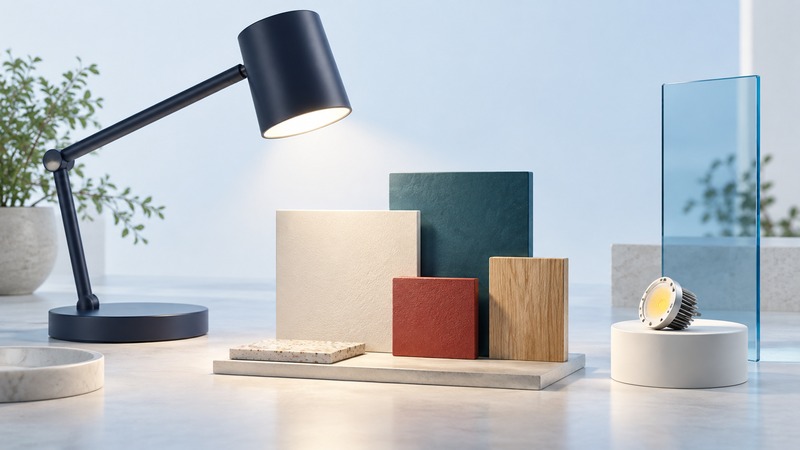
SunLike is Seoul Semiconductor’s LED technology family, marketed around a spectrum closer to natural light and high color rendering. Evaluate a lamp built with it by asking for measurements of the actual product and by checking the finished fixture in the room. The LED component is one part of the lighting result.
Understand what a spectral plot shows
A spectral power distribution shows how a light source’s output is distributed across wavelengths. Compare plots using the same scale, normalization, and operating conditions. A smooth-looking curve alone does not tell you how much light reaches a table, how comfortable the fixture is to look at, or whether its controls work well.
Seoul Semiconductor’s SunLike page presents its natural-spectrum positioning and a CRI 97 claim. Treat that as a manufacturer claim about the technology family; request the exact component or finished-product report for the model, color temperature, and operating point being considered. CRI is an index, so a value of 97 should be read as a score rather than “97 percent accurate color.”
The Department of Energy’s LED basics distinguishes light-source characteristics such as color appearance and color rendering. Correlated color temperature, expressed in kelvin, describes the appearance of white light. Two sources with a similar color temperature can still have different spectra and render colored objects differently.
Read more than one color metric
| Information | What it helps explain | What to check alongside it |
|---|---|---|
| CCT and color consistency | The white-light appearance and variation among units. | Measured product condition and tolerance. |
| CRI Ra and additional color data | Fidelity relative to the method’s reference source. | Which metric, test method, and individual results are reported. |
| TM-30 report | Color fidelity, gamut, and hue-specific shifts. | The complete report and the application’s visual priorities. |
| Spectral power distribution | Relative output across wavelengths. | Scale, normalization, CCT, and operating conditions. |
| Finished-fixture data | Light output, distribution, efficiency, and controls. | The complete fixture, driver, optics, and dimming arrangement. |
In its 2025 position statement on color-quality metrics, the CIE recommends adoption of its general color fidelity index Rf and parallel reporting with the older Ra during the transition. It also recognizes that color preference needs additional characterization. A fidelity score measures a particular comparison; personal preference and suitability for an application involve more.
DOE’s TM-30 FAQ explains a method with several measures and graphics, including fidelity and gamut information. Ask for the complete report when color quality is central to the purchase. A single favorable number can leave important hue changes unexplained.
Evaluate the complete lighting system
Check the fixture’s delivered lumens, distribution, mounting position, shielding, and available dimming range. An LED component’s specification does not establish the finished luminaire’s output after optics and thermal effects. The driver and controls also influence operation, including behavior at low brightness.
Identify the exact product code, CCT option, driver, and compatible dimmer. Ask whether the supplied test report covers that configuration or a different member of the range. For a tunable fixture, request information at the settings you plan to use.
Compare installed light where the task occurs. A bright exposed emitter can be uncomfortable even when its color metrics are excellent. A well-shielded fixture may still place too little light on a reading surface. Resolve those issues through position, distribution, and suitable output as part of the room plan.
Compare the same objects under controlled conditions
Keep health and safety claims tied to evidence
The CIE’s position statement on blue-light hazard distinguishes retinal photochemical hazard from effects associated with biological rhythms. They involve different questions and assessment methods. A photobiological risk classification needs its test conditions and exposure context; it cannot be expanded into an assurance for every viewing distance or use.
For a claim about sleep, alertness, or another health outcome, ask for the actual study, tested lighting conditions, exposure timing, population, and measured outcome. Spectral resemblance to daylight alone cannot establish a health benefit from a particular fixture in a particular room. Choose household lighting first for the task, comfortable visibility, appropriate controls, and documented product performance.