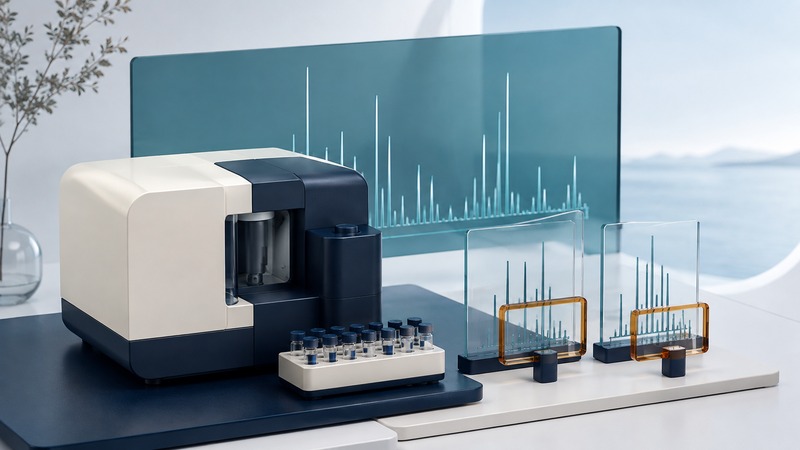
A mass spectrometer measures ions according to their mass-to-charge ratios and records their signals. It can help identify a substance, investigate structure or measure an amount, but those are different tasks. A peak becomes evidence through sample preparation, the measurement method, reference information and checks on alternative explanations.
This guide focuses on mass spectrometry, the established subject of this page. Optical spectrometers measure light and are a different instrument family. Before comparing mass spectrometers, decide whether the job is targeted quantification, screening for candidates or investigating unknown structures.
From sample to ion signal
A sample must produce ions that the instrument can transmit and measure. Ionization methods interact with substances differently, so the observed spectrum depends on how those ions were made. Chromatography may separate components before mass analysis; tandem mass spectrometry can select precursor ions, fragment them and measure the resulting product ions.
The IUPAC recommendations on mass-spectrometry terminology (PDF) define these stages and the language used to describe them. An ion's charge state matters: the horizontal position in a mass spectrum is m/z, not automatically the mass of the original neutral molecule. Different charge states, adducts, isotopes and fragments can produce several related signals from one substance.
A peak's intensity also needs interpretation. A large signal does not automatically mean a large concentration relative to another compound. Ionization response, matrix effects, transmission and the acquisition settings influence the signal. For quantitative work, use a calibration and quality-control approach demonstrated to work for that analyte and sample type.
Keep the chromatography and spectrum linked when both are used. The retention-time dimension can help distinguish components, but coelution remains possible. A visually clean peak in one display does not establish chemical purity in every dimension.
Compare analyzer roles, not one headline number
On a small screen, scroll the table sideways to read all columns.
| Analyzer or arrangement | Basic role | A useful question |
|---|---|---|
| Quadrupole mass filter | Uses electric fields to transmit selected mass-to-charge ranges. | Which ions are isolated or monitored, and how selective is the method? |
| Time-of-flight analyzer | Relates ion flight time under controlled conditions to mass-to-charge ratio. | What resolving power and mass error are achieved in the actual acquisition? |
| Ion trap | Stores ions and supports controlled isolation or fragmentation steps. | How do ion population and the scan sequence affect the result? |
| Hybrid instrument | Combines complementary components for selection, fragmentation and measurement. | Which component performs each step in the method I need? |
The Waters primer on mass-spectrometer types explains common analyzer arrangements, including quadrupole and time-of-flight systems. A hybrid can combine selection and fragmentation with a separate mass-analysis stage; the instrument name alone does not describe the entire acquisition method.
Modern hybrid systems also combine other analyzers. Thermo Fisher's mass-analysis settings documentation illustrates distinct roles for quadrupole isolation, an ion trap and an Orbitrap analyzer. The model's available settings should not be generalized into guaranteed performance for every instrument or sample.
Ask for evidence using the intended matrix, concentration range, scan speed and analysis method. A specification recorded under favorable calibration conditions may not describe a crowded spectrum acquired rapidly from a difficult sample. Include maintenance, method development, reference materials, software export and operator training in the evaluation.
Resolution and mass accuracy answer different questions
Resolving power describes the ability to distinguish nearby spectral features under a stated definition. Mass error describes the difference between a measured and reference mass-to-charge value. A narrow peak can be systematically displaced, and a well-centered peak can still overlap another signal.
The research article Mass Resolution and Mass Accuracy: How Much Is Enough? explains how signal-to-noise ratio, dynamic range and peak separation affect interpretation. Always record the convention used for a resolving-power value, such as full width at half maximum, and the m/z at which it is specified. Unequal peak heights make separation harder than an equal-height illustration suggests.
Now consider a second invented candidate reference at 300.0012. The same observed peak is about −1.0 ppm from that value. Both candidates fit the illustrative window around their own references. Neither reference here is assigned to a real molecule; the example shows why a close number alone does not select one chemical identity.
Download the checked mass-error example (CSV). It contains fixed results and the formula, including unrounded calculations. For real use, compare like ion species and the appropriate charge/adduct assignment. Comparing an observed protonated ion with an unadjusted neutral mass can create a false mismatch before the instrument's performance even enters the question.
Evaluate the whole identification
The NIST tandem mass spectral library supplies measured reference spectra to support compound identification. Matching fragmentation patterns provides information beyond one precursor value. The comparison still depends on compatible ionization, precursor selection and fragmentation conditions, as well as the quality and coverage of the reference data.
A high similarity score is a result from a scoring method, not automatically a calibrated probability that the proposed identity is correct. NIST's MSMatch documentation describes a concrete workflow for matching experimental spectra to a curated library. Preserve the tool, library version, tolerances and processing choices so another analyst can understand what was compared.
Review isotope patterns, informative fragments, retention behavior where relevant, blanks and possible interference. A reference standard measured under a suitable method can provide stronger confirmation than a database suggestion alone. Isomers may remain difficult to distinguish; reporting a candidate or a class can be more defensible than claiming a uniquely identified structure.
Separate detection, identification and quantification in the report. Detecting a feature above background does not by itself identify it. An identification does not by itself validate an amount. State the actual evidence and the method's limitations instead of attaching the strongest possible label to every peak.
Keep enough information to challenge the result
A usable record includes sample identity and preparation, blanks and controls, instrument and method versions, ionization polarity, relevant acquisition settings, calibration information, raw files and processing history. Retain the observations behind a proposed identification rather than only a final spreadsheet of compound names.
For a service request, describe the question first: “confirm this target in this matrix” is a different task from “screen for possible unknown contaminants.” Agree how ambiguous findings and results below the method's reporting capability will be communicated. This prevents a successful instrument run from being mistaken for a completed analytical answer.
AI can assist with formatting reports, inspecting metadata or drafting calculations. Verify calculations against known cases and require source spectra for identification claims. Do not let generated explanations invent fragments, standards or acquisition conditions that were never measured. The defensible result is the one supported by the retained evidence.
Related resources
- Verify sample-transfer accuracy and repeatability
- Ion traps in mass spectrometry
- Plan controls and independent observations
- Explore all science resources
Researched and updated September 6, 2026. Consult the linked primary sources for methods, evidence, and limitations.