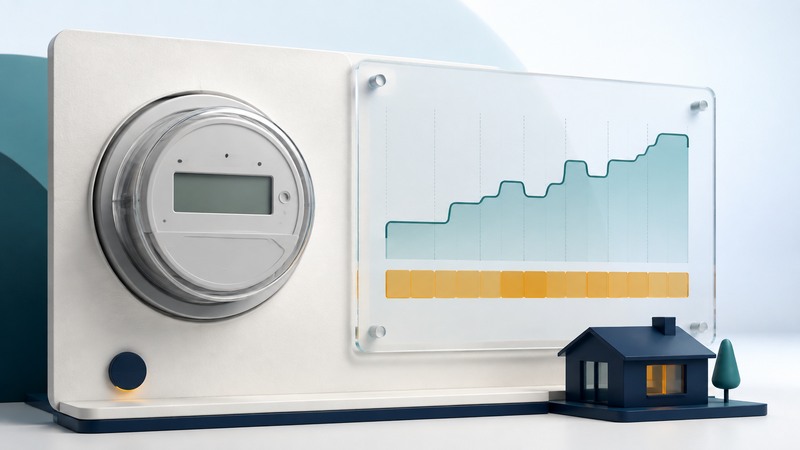
A smart meter can provide a time record of electricity use. To make that record useful, identify the units, interval duration and tariff, then check that the data matches the service and dates you intend to analyze.
Start with your utility account’s usage download, the relevant bill and the complete rate sheet. Keep the original export unchanged. Available intervals, delay, export formats and permission controls differ by utility.
Obtain the right data and read its definitions
Download a period covering the question you want to answer. A recent week can reveal a schedule pattern; a full year is better for comparing seasonal tariffs. Confirm the service address, meter or service identifier, timezone, interval start/end convention and any estimated readings.
As one utility example, PG&E’s Energy Data Hub describes Green Button downloads and separate ways to authorize data sharing. Other utilities use different interfaces. An account export can contain personal identifiers and detailed occupancy patterns; share only the information needed for the task.
If timestamps repeat at a daylight-saving change, inspect their timezone offsets or the utility’s documentation before deleting rows. Missing values represent unknown data until resolved; replacing them with zero can understate consumption.
Keep kW, kWh and meter registers distinct
Kilowatts measure power. Kilowatt-hours measure energy used over a period. If one 15-minute interval contains 0.50 kWh, its average power is 0.50 ÷ 0.25 = 2 kW. That average does not reveal the highest instantaneous startup load.
An interval file may contain energy for each interval, average demand, cumulative meter readings or separate import and export channels. Read the column definitions before adding or subtracting values. Cumulative readings need differences between readings; interval energy can generally be summed after checking completeness and units.
For a solar home, grid import and export describe exchange with the grid. The solar inverter measures another quantity: generation. Behind-the-meter self-consumption can mean neither source alone represents total household use. See solar savings calculations for why self-consumption matters.
Compare a small fictional tariff example
On a narrow screen, scroll the table sideways. Keyboard users can focus the table region and use the arrow keys.
| Interval start | Duration | Energy | Illustrative rate |
|---|---|---|---|
| 17:00 | 15 minutes | 0.50 kWh | $0.30/kWh |
| 17:15 | 15 minutes | 0.75 kWh | $0.30/kWh |
| 17:30 | 15 minutes | 0.25 kWh | $0.10/kWh |
| 17:45 | 15 minutes | 0.50 kWh | $0.10/kWh |
The invented rate changes at 17:30 only to make the example compact. Real tariffs can have seasons, weekends, holidays, demand charges, tiers, minimum bills, fixed charges and separate export credits. Apply the complete actual tariff to a representative period before changing plans. PG&E’s rate-plan comparison is one example of a utility-provided comparison route.
Investigate patterns without assigning a cause too early
A persistent overnight baseline is a reason to inventory always-on devices, refrigeration, networking and scheduled equipment. A morning peak may reflect several loads starting together. Compare activity logs and equipment schedules before attributing the pattern to a specific appliance.
If you change a discretionary setting, record the date and compare similar days. Weather, visitors, remote work and an EV charging session can all alter the result. Use the home energy action log to keep the context beside the measurements.
Interval data alone cannot diagnose faulty wiring, a failed meter or an unsafe appliance. If readings appear implausible, check units and cumulative-versus-interval definitions first, then ask the utility to explain the record. Report burning smells, sparks or unusual service voltage symptoms as electrical concerns through the appropriate utility or emergency channel.
Reconcile the result to the bill
- Match exact billing start and end dates and verify how boundary intervals are treated.
- Check missing or estimated readings and distinguish import, export and netting rules.
- Calculate each tariff component at its stated time and unit, retaining precision until the required rounding step.
- Add fixed charges, taxes and other applicable items separately.
- Record any difference and ask the utility about its billing definitions before treating it as an error.
Use the downloadable synthetic example to practice the units and arithmetic without exposing an account file. A rate comparison should report both total energy and estimated total bill: shifting time can reduce price while leaving energy unchanged.
Synthetic interval data and rate exercise
Synthetic interval data and rate exercise — plain-text download. Save a copy and fill it in with your own information. The file includes instructions, assumptions and references so it can be used independently.