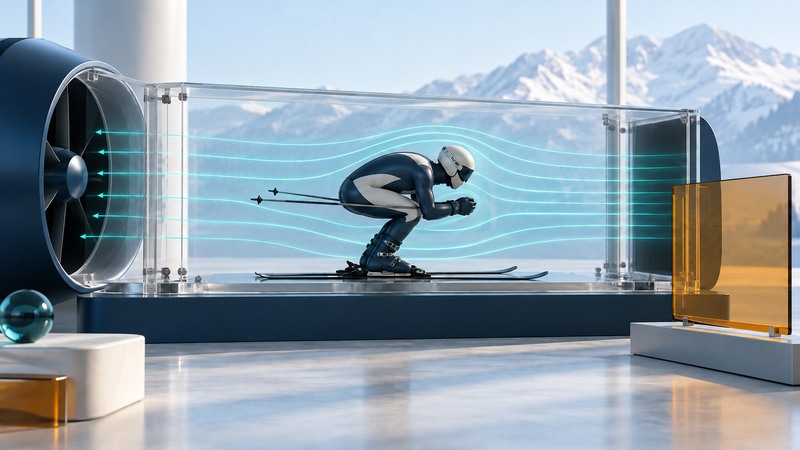
A skiing wind tunnel lets researchers compare aerodynamic drag while controlling the airflow and observing a skier’s posture. Its strongest result is a measured difference under stated conditions. Turning that difference into a faster descent also requires evidence about the course, snow, movement and the athlete’s ability to sustain the position.
Know which quantity is being measured
Drag is the force from the air opposing motion relative to that air. A tunnel moves air past a skier or model while instrumentation measures forces. Researchers can compare positions or equipment at matched air speeds; photographs or motion measurements help establish whether the posture was actually reproduced.
A common expression is D = ½ × ρ × CdA × v². D is drag in newtons; ρ is air density in kilograms per cubic metre; CdA is drag coefficient multiplied by reference area, in square metres; v is air speed relative to the skier in metres per second. The 2018 study An Empirical Model of Aerodynamic Drag in Alpine Skiing uses this relationship to model posture-dependent drag.
CdA combines size and aerodynamic behavior. It can change with body position, equipment and airflow conditions. Hold it constant only as an explicit simplifying assumption when exploring the square-of-speed relationship. Wind speed relative to the skier and ground speed are also different quantities when wind is present.
Work through a controlled numerical example
| Case | Air speed | CdA | Calculated drag |
|---|---|---|---|
| Baseline | 25 m/s (90 km/h) | 0.25 m² | 93.75 N |
| Changed CdA, same speed | 25 m/s (90 km/h) | 0.23 m² | 86.25 N |
| Higher speed, baseline CdA | 30 m/s (108 km/h) | 0.25 m² | 135.00 N |
Swipe the table sideways, or focus it and use the arrow keys.
The 8% figure describes drag under fixed conditions. Predicting speed or elapsed time requires a model of the downhill forces and motion, including gravity along the slope, ski–snow resistance and turns. A race also includes time spent outside the tested tuck. These example inputs are teaching values, not measured performance for a product or athlete.
Read the test population and method
A 2021 Journal of Biomechanics study of tucked positions combined wind-tunnel experiments with computational fluid dynamics and examined changes in torso and thigh position. Its small group of elite skiers and specific tested postures define the scope of its findings. Treat the result as evidence about those comparisons, then ask what further testing would support a broader claim.
A 2023 study of ski-pole effects on aerodynamic drag analyzed tunnel data from ten elite skiers across three postures and three air speeds, with repeated measurements. The design illustrates why body position and repeatability belong in an equipment comparison. A change attributed to a pole can be confounded by a change in how the skier holds it.
Computational fluid dynamics can help explain where pressure and flow separation contribute to drag. Its value depends on the modeled geometry, boundary conditions and comparison with measurements. A colorful flow image is a visualization of a model; the methods and validation establish what confidence to place in it.
Ask for a comparison you can interpret
| Question | Why it matters | Useful evidence |
|---|---|---|
| Were speed and air density matched? | Both affect force independently of the proposed change. | Recorded conditions and any normalization method. |
| Was posture reproduced? | Small body changes can alter drag. | Images or motion data, with repeated baseline trials. |
| How variable were repeated measurements? | A small apparent improvement may overlap ordinary variation. | Individual trials, uncertainty and a stated analysis. |
| Who and what were tested? | One athlete or model cannot establish every fit and body shape. | Sample description, equipment versions and test configurations. |
| What happens on snow? | Control, line choice and changing posture influence race time. | A separate field comparison with course and conditions documented. |
Swipe the table sideways, or focus it and use the arrow keys.
For example, imagine baseline measurements of 94, 96 and 93 N, followed by changed-setup measurements of 92, 95 and 94 N. Their means differ by less than 1 N and the ranges overlap. Those invented observations invite more analysis and repeat testing before claiming a dependable improvement. They do not establish a threshold that applies to every laboratory.
Use the tunnel to isolate a question, then test the practical consequence in the relevant skiing context. A posture with lower measured drag still needs to fit the athlete’s control, movement and event demands. This guide explains evidence interpretation; technique changes belong in the athlete’s coached training process.