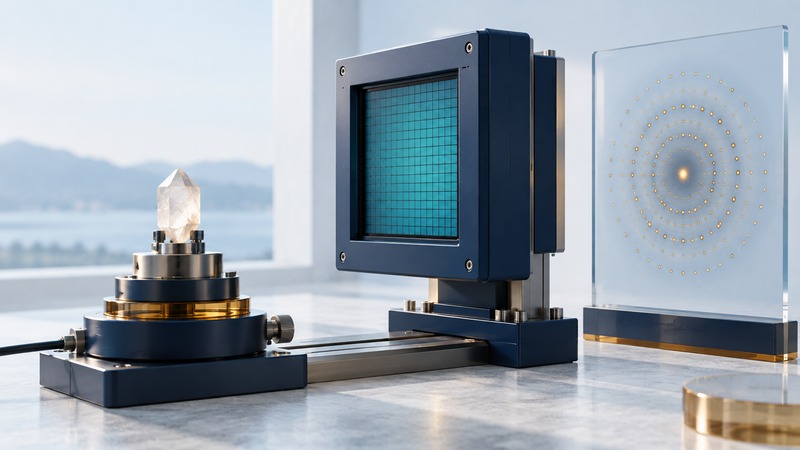
An X-ray detector converts arriving radiation into a record of intensity, position, time or energy, depending on its design. Choosing one starts with the measurement: the photons you expect, the pattern you need to capture and the uncertainty you can accept. A single headline specification rarely describes all three.
This guide helps students and diffraction users interpret specifications and discuss an experiment with instrument staff. Use the facility's approved procedures for equipment operation and radiation protection.
Follow the signal into the recorded image
Detector designs use different conversion paths. An integrating detector accumulates a signal over an exposure. A photon-counting detector resolves individual events within its operating limits. In a hybrid pixel detector, a sensor layer and separately fabricated readout electronics are connected pixel by pixel.
The DECTRIS explanation of hybrid photon counting describes how an absorbed photon produces charge and how a threshold selects a counted event. It also explains why sensor material and photon energy affect detection efficiency. This is a technology overview; exact operating limits belong to the model and configuration being used.
Write the photon energy or energy range into the experiment plan. A detector's response at one energy may differ substantially from its response at another. Ask which filters, thresholds and response corrections are included in the reported result.
Connect pixel size to the experiment's geometry
Pixel pitch is a distance on the detector. In a diffraction experiment, the angular interval associated with that distance also depends on sample-to-detector distance and detector orientation. Beam divergence, sample size, detector response and alignment contribute to the complete measurement.
Sketch the expected pattern and the active detector area. Check whether gaps, a beamstop or inaccessible angles could hide a feature important to the question. More pixels help only when they capture useful information under the actual conditions.
Read rate, range and timing together
On a narrow screen, focus this table and use the arrow keys to scroll.
| Quantity | Ask for | Interpretation |
|---|---|---|
| Count rate | Limit per pixel, energy and correction assumptions. | A bright local spot can exceed a limit while the whole-image rate looks modest. |
| Dynamic range | Usable minimum and maximum signal for the specified exposure. | Weak and strong features must both remain interpretable. |
| Frame timing | Exposure, readout gaps, trigger behavior and timestamp definition. | Frame rate alone leaves parts of the time record unspecified. |
| Response uniformity | Calibration, masked pixels and uncertainty. | Pixel differences can otherwise become apparent sample structure. |
Photon-counting electronics need time to process events. At high local rates, events can overlap and the response can become nonlinear. The DECTRIS overview distinguishes this event-level limitation from readout timing between frames. Read the stated correction range and uncertainty before accepting a corrected intense peak.
If intensity stops increasing as expected, investigate the detector's range, beam monitoring, sample changes and acquisition settings. A flat-topped feature or unexpected exposure dependence is a reason to review the measurement with instrument staff.
Bring a measurement requirement to the instrument discussion
Describe the expected energy, angular range, smallest feature of interest, strongest and weakest useful signals, and time scale. State whether the goal is locating peaks, comparing intensities, following a change or obtaining quantitative structural data. These goals impose different demands.
Plan appropriate reference measurements, geometry calibration, response checks and treatment of unusable pixels. Preserve raw frames and acquisition metadata alongside processed patterns. A processing pipeline should document which corrections and masks were applied.
Download the detector planning sheet to record requirements and unresolved questions. Compare its completed fields with the actual instrument manual and a representative pilot measurement. The X-ray diffraction guide explains how those measurements support interpretation of a pattern.
Related science guides
Explore all science guides. Sources reviewed September 11, 2026.