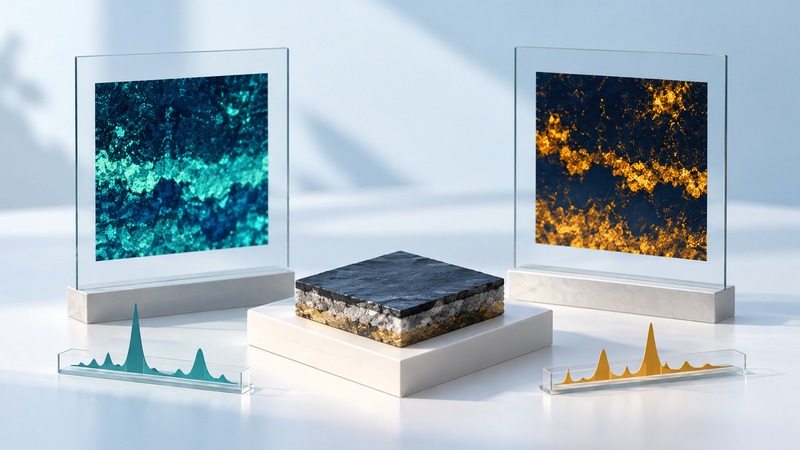
An elemental map shows how a measured X-ray signal varies across a sample. Its colors become useful evidence when you know which element and spectral line were measured, how the image was processed and what the sample geometry allows you to conclude. Start with the spectrum behind the bright patch.
This guide concerns X-ray fluorescence and related characteristic-X-ray imaging, including materials and semiconductor analysis. Optical fluorescence microscopy measures light from a different process. A similar-looking colored image can therefore answer a very different question.
Connect each pixel to a spectrum
When an inner electron vacancy is filled by an electron from a higher energy level, an atom can emit a characteristic X-ray. The photon energy helps identify the element. An energy-dispersive detector records counts across an energy spectrum; scanning the sample builds a spatial record. Diamond Light Source's XRF explanation connects this process to mapping and the role of calibrated standards in quantitative work.
Record the excitation source. An incident X-ray beam and the electron beam of an electron microscope can both generate characteristic X-rays, but their interaction volumes and experimental arrangements differ. Use the instrument's own method description when discussing depth sensitivity or resolution. Here, a “map” means a spatial display of selected or fitted spectral signal, whatever the acquisition implementation.
Read the legend before comparing colors
On a narrow screen, focus this table and use the arrow keys to scroll.
| Look for | Why it changes interpretation | Useful check |
|---|---|---|
| Signal definition | Raw counts, count rate, fitted peak area and concentration are different quantities. | Read the legend and processing record. |
| Color scale | Two separately autoscaled maps can look equally bright despite different signals. | Use a common scale for a justified comparison. |
| Line assignment | Nearby spectral lines or background can contribute to a selected window. | Inspect representative spectra and any fitted residuals. |
| Spatial sampling | A small pixel spacing does not alone establish that features of that size are resolved. | Record beam size, step size and relevant instrument response. |
| Sample geometry | Thickness and overlapping material affect the recorded signal. | Compare with preparation notes and another view where useful. |
Choose a bright region, a dark region and an apparent boundary, and inspect the spectrum at each. Check whether the assigned line is distinguishable and whether a second line or independent measurement supports the interpretation. A fitted elemental map should retain enough information to inspect the fit, including how the background was modeled.
Diamond's I14 XRF guidance specifically discusses spectral overlap, fitting rather than simple windowing, sample thickness and detector saturation. Its stated performance applies to that beamline, not every fluorescence imager.
A brighter pixel can simply have a longer exposure
Write the normalization next to the result. If incident intensity varies, live time alone may be insufficient. If background dominates one pixel, dividing total window counts by time preserves that background too. These checks explain why a numerical image export is more useful when accompanied by raw spectra and acquisition metadata.
Ask what volume contributed to the image
A two-dimensional display can contain signal from material along the beam path and within the detection geometry. A bright patch may reflect composition, greater material thickness or an overlapping layer. Changing viewing angle or using a complementary structural measurement can help test those alternatives, but the choice should follow the sample and question.
Elemental co-location is useful evidence that signals occupy the same resolved region. Establishing a particular compound or chemical state needs additional evidence. For crystalline phases, X-ray diffraction supplies structural information; absorption spectroscopy may address other chemical questions. State the conclusion at the level the measurement supports.
Keep a report that makes the interpretation checkable
Include the sample identifier, preparation and thickness information, excitation conditions, detector and geometry, beam and step sizes, acquisition times, line assignments, normalization, fit settings, standards and uncertainty assessment. Preserve a scale bar and the original data instead of only a screenshot.
A useful conclusion is specific: “The fitted signal assigned to element X is concentrated in these resolved regions under this acquisition and calibration.” Add a concentration only when its method and units are established. For an apparent absence, give the applicable detection limit or state that the measurement did not resolve a signal. That wording leaves room for a lower concentration, an unfavorable excitation condition or material outside the sampled volume.
Related science guides
- Read diffraction patterns for structural evidence
- Understand synchrotron beamlines
- Preserve raw data and processing steps
Explore all science guides. Sources reviewed September 11, 2026.