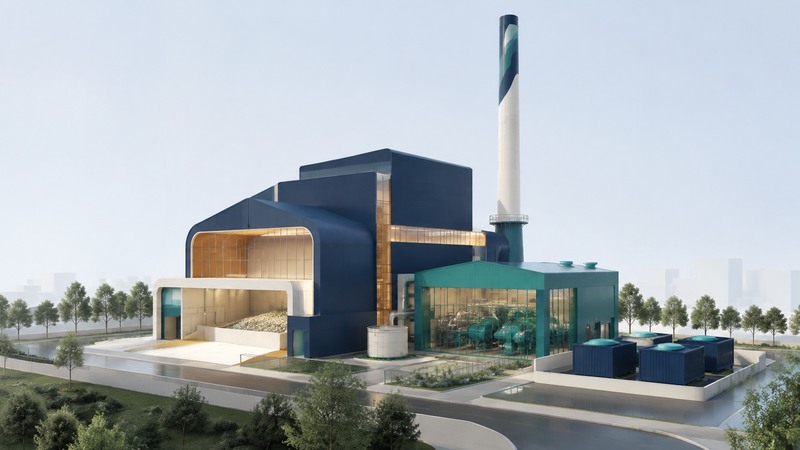
Evaluate waste-to-energy as both a waste-management service and an energy project. Begin with the waste that remains after prevention and material recovery, then compare net electricity, useful heat, emissions and residual disposal against realistic alternatives for the same waste.
This guide focuses on controlled combustion of municipal solid waste. Anaerobic digestion, landfill-gas recovery, gasification and other conversion routes have different feedstocks and processes. Identify the actual technology before comparing a proposal’s claims.
Define the waste and the alternative
EPA’s municipal-waste combustion guidance places energy recovery below source reduction and recycling/reuse in the non-hazardous waste hierarchy. A sound comparison documents the remaining waste stream and tests how prevention, recycling and organics diversion change its quantity and composition.
Ask for measured incoming mass, seasonal variation, rejected materials and the proposed supply contract. A long-term minimum-tonnage commitment should be examined alongside diversion goals. Name the alternative disposal facility and transport route; a hypothetical landfill with different gas collection or travel distances can change the comparison.
EIA’s waste-to-energy explanation distinguishes biogenic materials such as paper and food from petroleum-derived plastics and noncombustible glass or metals. Record the method and basis for any renewable fraction: a mass fraction and an energy fraction answer different questions.
Count energy at the delivery boundary
Combustion heat can make steam for electricity generation or supply heat to a customer. Record gross generator output, the plant’s own electricity use and net export separately. For heat, identify the customer, delivery temperature and actual demand over the year. Heat rejected to the environment contributes no useful heat delivery.
On a narrow screen, scroll the table sideways. Keyboard users can focus the table region and use the arrow keys.
| Item | Assumed value | Interpretation |
|---|---|---|
| Waste processed | 180 metric tonnes | Input mass for this example only. |
| Gross generation | 144 MWh | Equivalent to 6 MW sustained for 24 hours. |
| Plant electricity use | 24 MWh | Equipment consumption inside the stated boundary. |
| Net electricity export | 120 MWh | 144 − 24; average net power is 5 MW. |
| Net export per input mass | About 667 kWh per metric tonne | 120,000 kWh ÷ 180 metric tonnes. |
These invented figures demonstrate units; they are neither a facility rating nor an efficiency claim. Calculating efficiency also requires the waste’s fuel-energy input on a stated heating-value basis. Specify metric tonnes or U.S. short tons, and compare matching periods. MW describes power; MWh describes energy over time.
For combined heat and power, EPA’s efficiency method combines net useful electricity and useful heat against fuel input. State those outputs individually so an impressive total does not obscure how much electricity reaches the grid or how much heat a customer actually uses.
Read the operating and residual records
EPA’s combustion guidance describes air-pollution controls and the need to assess ash. Ask the operator for the facility’s actual permit, stack-test results, continuous monitoring reports where required, exceedance records and corrective actions. Match each measured pollutant, unit and averaging period to the applicable limit. The presence of a control device alone leaves its operating performance unresolved.
Track bottom ash separately from fly ash and pollution-control residues, including any metals recovered. Request characterization results, handling arrangements, destination and the authority for any reuse. Add truck traffic, receiving-area odors, noise, water use and local emergency arrangements to the site assessment.
For climate claims, compare the same waste and useful energy services. EPA’s WARM management-practices documentation explains its combustion and landfill modeling boundaries. Results depend on material composition, alternative disposal emissions, recovered energy and displaced generation. Keep fossil and biogenic carbon assumptions visible and treat a general model as screening evidence alongside local operating data.
Build a facility comparison that can be checked
Make one record for each option: annual accepted waste, net exported electricity, delivered heat, air emissions, residual destinations, truck movements, total costs and contract duration. Attach the document date and responsible party to every entry. Mark whether values are guaranteed, modeled or measured.
Stress-test lower throughput, changed waste composition, energy-customer loss and downtime. Ask who pays for backup disposal and plant maintenance during an outage. Compare net cost per unit of waste managed with the same transport, disposal and revenue assumptions.
Use the biogas guide for a separate assessment of suitable organic feedstocks. For a combustion project advertising capture equipment, use the carbon-capture guide to follow the complete capture and storage chain.
Waste-to-energy facility comparison
Waste-to-energy facility comparison — plain-text download. Save a copy and fill it in with your own information. The file includes instructions, assumptions and references so it can be used independently.