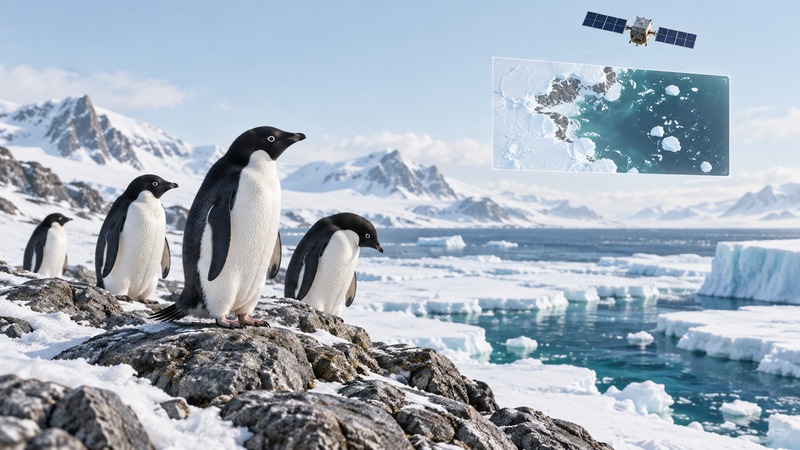
To understand a penguin-and-ice headline, ask which species, which colony or region, which season, and what was measured. Sea ice can provide breeding habitat, shape access to feeding areas, and affect the surrounding ecosystem. Its consequences depend on the place and timing, so a useful explanation connects images with the animals’ life cycle.
Start with the breeding habitat
Adélie penguins build pebble nests on ice-free ground. Ice conditions can affect the journey between those nests and feeding water. The Australian Antarctic Program’s Adélie account describes their breeding sites and parental feeding trips.
Emperor penguins generally breed on stable land-fast sea ice attached to the coast. Early breakup can remove that platform before chicks are ready for the water. A British Antarctic Survey study of the 2022 Bellingshausen Sea season linked early ice loss with likely complete breeding failure at four of five examined colonies. The study was published in 2023; the event and publication dates describe different things.
A dated case: Ross Sea icebergs in 2000–2001
On December 27, 2001, NASA JPL reported on MISR imagery of the Ross Sea. Icebergs originating in the March 2000 breakup of the Ross Ice Shelf moved toward McMurdo Sound. The image sequence showed C-16’s movement and subsequent stall, the arrival of B-15A, and extensive sea ice.
The report connected the ice configuration with difficulty returning from open-water feeding grounds to breeding areas. Read this as a regional episode involving the placement and movement of ice. The imagery documented the physical setting, while biological interpretation drew on the associated penguin research. Predictions made in that 2001 report describe concern at that time; they are not a current colony census.
Match the picture to the question
On a small screen, focus this table and use the arrow keys, or swipe, to read all columns.
| Evidence | Useful question | What else is needed |
|---|---|---|
| Sea-ice image sequence | When and where did access or breeding ice change? | Colony location, season, species, and biological observations. |
| Visible colony footprint or guano staining | Where is a colony, and how has its visible extent changed? | Image resolution, acquisition conditions, and a validated estimation method. |
| Repeated population estimates | How did estimated abundance change over the sampled years? | Uncertainty, comparable methods, and coverage of other colonies. |
| Tracked feeding trips or colony monitoring | How do individual trips or breeding outcomes relate to conditions? | Sample size, time coverage, and how representative the observations are. |
The Australian Antarctic Program illustrates Adélie foraging tracks over satellite images. Tracking an animal supplies movement information; imaging the water and ice supplies environmental context. The combined view can answer a question that either dataset alone leaves open.
Distinguish a breeding failure from a population trend
Breeding success concerns production or survival of chicks during a season. A population estimate concerns how many animals are present under a stated counting method. A colony may also shift location. Compare like measures across years before describing a trend.
In a June 2025 satellite analysis, British Antarctic Survey reported an estimated 22% decline over 2009–2024 in a sector encompassing the Antarctic Peninsula, Weddell Sea, and Bellingshausen Sea. The geographic coverage is part of the result. Applying that percentage to every Antarctic colony would require a continent-wide analysis.
For a shorter-term comparison, BAS’s 2024 report on the 2023 season examined colonies affected by early sea-ice breakup using Sentinel-2 imagery. Its unit of comparison was affected breeding colonies. That differs from counting all individual penguins.
Make a five-line evidence note
When sharing a finding, write down: species; place and spatial coverage; observation years; measurement and uncertainty; and the conclusion supported. Add the original study or agency link. For an image, also check the acquisition date, scale, and whether it is a photograph, processed dataset, or conceptual illustration.
A useful description might say “a study of emperor breeding colonies in this region during this season found early ice loss and inferred poor chick survival.” It tells the next reader which evidence to inspect and keeps a regional observation connected to its actual limits.