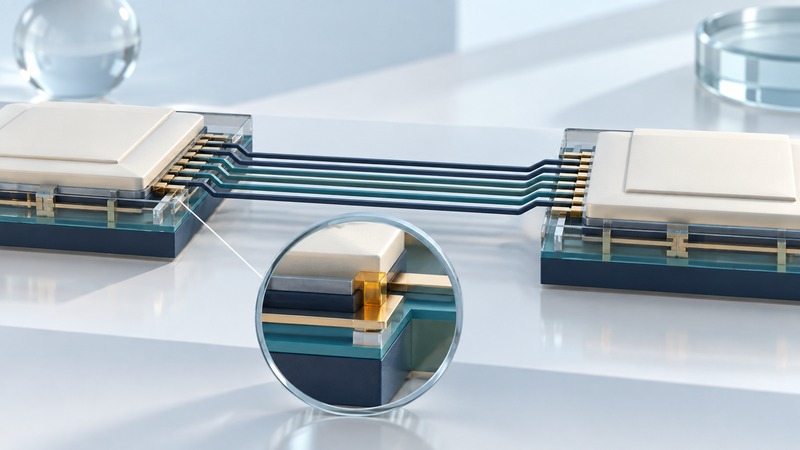
Chip interconnects carry signals between circuit elements. Their usefulness depends on how reliably a voltage change reaches its destination within the available time. Conductor resistance, capacitance, contacts and the circuits at both ends all contribute to that result.
To read a claim about faster interconnects, first identify what was measured: resistance, frequency response, propagation delay or a complete circuit's performance. This guide connects those quantities and uses a carbon-nanotube experiment to show how the evidence fits together.
Follow the whole signal path
A driver must charge and discharge capacitance through resistance. The wiring also couples to nearby conductors. David Harris's lecture on interconnect RC models (PDF) explains how wire resistance, distributed capacitance, driver resistance and the receiving load enter a delay estimate. Its numerical technology examples are historical; the circuit-model distinctions remain useful.
Changing material can alter one contribution while contacts or geometry continue to dominate another. Longer paths add both resistance and capacitance. In a simple uniform distributed RC model without repeaters, the wire's own delay contribution grows with the square of length. Actual routes require their loads and topology to be included.
For a comparison, keep path length, cross-section, spacing, load and operating conditions visible. State whether contact resistance belongs to the reported result. That makes it possible to distinguish an improvement in a material from an improvement in a connected circuit.
Use a simple model with a clear boundary
A result in picoseconds describes a time interval. A result in gigahertz describes cycles per second. At 10 GHz, one period is 1 ÷ 1010 s = 100 ps. Converting the units helps interpretation, but the period of a test signal alone supplies no measured end-to-end delay.
Read the nanotube result at its demonstrated scale
Yu and Burke's 2005 “Microwave Transport in Metallic Single-Walled Carbon Nanotubes” measured dynamical conductance from DC to 10 GHz in contacted nanotube devices. The work compared AC and DC behavior as the source–drain bias changed.
The authors found behavior consistent with AC conductance tracking DC conductance over their measured range. Extracting the small nanotube response required accounting for the surrounding measurement structure; they reported about 50% uncertainty in absolute AC conductance. The experiment establishes high-frequency electrical response in the tested devices. It provides neither a direct measurement of signal propagation speed nor a processor benchmark.
Its value is a specific transport result that later circuit work can build on. When following that progression, look for evidence about reproducible contacts, integration, device variation and measured timing under realistic loads.
Match each claim to the missing test
On a narrow screen, focus this table and use the arrow keys to scroll.
| Reported result | Question to resolve |
|---|---|
| Low resistance | At what length, cross-section, temperature and contact configuration? |
| Response at high frequency | Which response quantity, calibration and uncertainty were reported? |
| Short delay | Between which points and voltage thresholds, with what load? |
| Faster circuit | Which workload or timing path improved, and at what energy and reliability? |
Write a one-sentence conclusion using the measured quantity and conditions. For example: “This device maintained the reported conductance response over the tested frequency range.” Then list the next experiment needed for the broader application. That keeps the scientific contribution clear while making progress toward a useful chip measurable.
Related science guides
- Connect device scaling to circuit tradeoffs
- Understand nanotube population control
- Interpret properties inferred from measurements
Explore all science guides. Sources reviewed September 11, 2026.