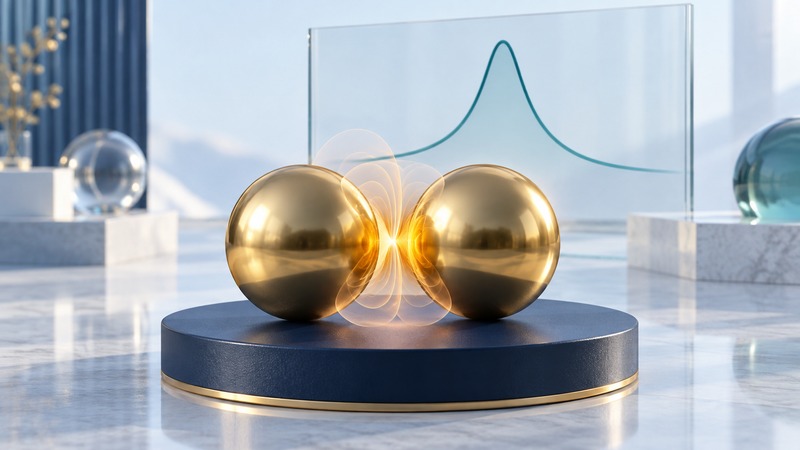
A small metal particle can reshape the electromagnetic field of incoming light. Under suitable conditions, its conduction electrons respond collectively, producing a localized plasmon resonance. The field near the surface can become strong and uneven, making particle shape, spacing and surroundings important to an optical measurement.
This guide focuses on metallic nanoparticles and their near fields. It helps readers interpret spectra and field maps, especially when a striking hotspot is used to support a claim about sensing or light concentration.
Separate the optical responses
Absorption transfers optical energy into the material; scattering redirects light. Extinction describes the removal of light from an incident beam through both processes under the measurement's definition. A large extinction peak alone leaves their individual contributions to be determined.
In his account of modeling nanoscale properties, George Schatz explains how particle geometry and the surrounding material influence calculated optical spectra and local fields. Comparing shapes at a fixed volume helps isolate a shape effect; comparing unrelated particles can mix several causes.
For a real sample, record composition, size distribution, shape and aggregation. A solution's spectrum combines responses from its population. A single-particle measurement addresses a different question and needs its own geometry and background controls.
Know where the field is being described
The near field is the local electromagnetic environment close to the particle. A far-field detector measures light that has propagated away. A strong field at a tiny surface region and a bright signal collected at a distance are connected through the experiment, but they are different quantities.
Sharp features and gaps between particles can concentrate fields under suitable excitation. The location and strength depend on such details as polarization and wavelength. A map therefore needs those conditions, together with the plane or surface on which the field is shown.
Models also have a range of validity. At very small separations or atomic scales, the assumptions of a continuous bulk material can become inadequate. Schatz discusses this boundary between classical field calculations and more detailed electronic descriptions. Treat a dramatic numerical maximum as something to examine for convergence and physical assumptions.
Read the quantity behind the colors
On a narrow screen, focus this table and use the arrow keys to scroll.
| Look for | Question it answers |
|---|---|
| Field quantity | Is color showing amplitude, squared field, absorbed power or another quantity? |
| Normalization | What reference field or incident power is used? |
| Geometry and scale | Where is the map relative to the particle and how large is the region? |
| Excitation | Which wavelength, polarization and illumination geometry produced it? |
| Evidence type | Is it a simulation, a directly measured signal or a reconstruction? |
Connect concentration of light to a useful outcome
A sensor may benefit when its target molecules occupy regions with a useful optical response. That goal also involves target delivery, surface chemistry, background, reproducibility and how light is collected. A hotspot that the target cannot reach contributes differently from an accessible, repeatable sensing region.
Absorbed energy can also produce heat. Argonne's work on gold-nanorod heating and shape evolution illustrates why geometry and thermal behavior belong in the same discussion. Include absorption and heating when assessing the useful optical response.
To compare two claims, hold the question constant. Record the target signal, incident conditions, sample geometry, measured uncertainty and practical outcome. Then ask whether the improvement survives multiple samples and relevant operating conditions. This connects nanoscale optics to evidence a reader can actually use.
Related science guides
- Distinguish optical emission from field concentration
- Read particle shape and scale
- Interpret maps through their signal definitions
Explore all science guides. Sources reviewed September 11, 2026.