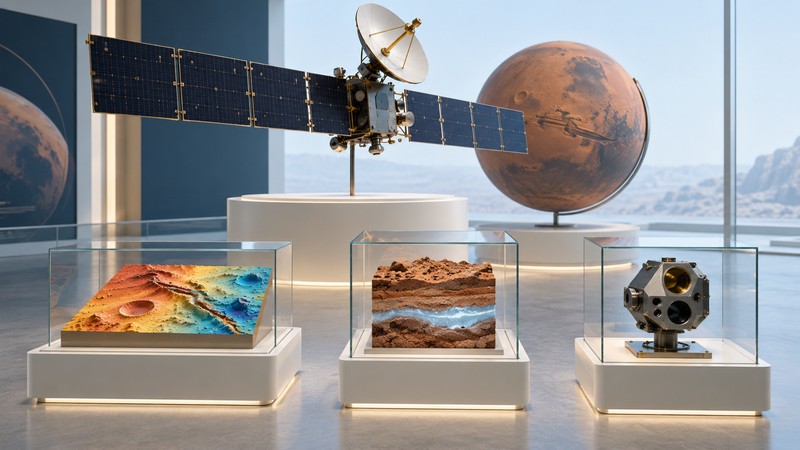
Mars Odyssey connects three questions: what the Martian surface is made of, where hydrogen points to buried water ice, and what radiation a spacecraft encounters near Mars. Its long record shows why a mission's scientific value comes from combining measurements and preserving them for later study.
A mission with several scientific chapters
NASA's 2001 Mars Odyssey launched on April 7, 2001. Its arrival burn took place on the evening of October 23 in California, already October 24 in UTC. Both dates therefore appear in mission histories. The original report at this URL anticipated that arrival; the mission went on to complete its primary science phase and many years of further observations.
- April 2001: launch and the start of the journey to Mars.
- October 2001: orbital capture, followed by aerobraking to reshape the initial orbit.
- February 2002–August 2004: the primary science mission.
- October 2003: MARIE stopped collecting data after a major solar event.
- October 13, 2026 status check: NASA lists Odyssey as an active mission.
The NASA mission record provides current context. A spacecraft can continue working after an individual instrument's observing period ends, so dates belong with the particular dataset being discussed.
What its instruments measured
| Investigation | Measurement | Scientific use and limit |
|---|---|---|
| THEMIS | Visible images and thermal-infrared observations | Relate surface materials to terrain; temperature and observing conditions also affect the signal. |
| Gamma Ray Spectrometer suite | Gamma-ray and neutron measurements | Map elements and shallow-subsurface hydrogen; interpretation requires models of the material being sampled. |
| MARIE | Energetic-particle measurements during its operating period | Characterize aspects of the radiation environment; use the date, location and detector response with the result. |
The instrument reference explains these capabilities. THEMIS stands for Thermal Emission Imaging System. The GRS investigation included a gamma-ray detector and neutron detectors, bringing complementary measurements to the same elemental-mapping task. MARIE stands for Mars Radiation Environment Experiment; NASA dates its loss of data collection to October 28, 2003.
The instruments answer different questions at different spatial scales. Reading their results together requires attention to the area represented by each measurement. A regional hydrogen map cannot supply the detail of a close-up surface photograph.
How hydrogen measurements inform the ice story
Cosmic rays interacting with the ground produce secondary radiation. The resulting gamma-ray and neutron signals carry information about the near-surface material. Hydrogen changes the neutron signal in a way that can help researchers estimate its abundance. Water contains hydrogen, making these measurements valuable for locating ice-rich ground.
Odyssey's maps helped reveal extensive buried ice at high latitudes. NASA's science overview places that discovery within the mission's broader mapping work. The strongest interpretation combines the measured signal with temperature, geological setting and other observations.
What a thermal image adds to a visible view
A visible image helps you describe shape and brightness. A thermal observation adds information about how the surface emits heat. Material properties and the time of observation influence the result, so begin with the caption's explanation of whether you are viewing daytime temperature, nighttime behavior or a combination of spectral bands.
Try this reading exercise with an image from the THEMIS collection at Arizona State University: first describe the landform, then identify the displayed quantity, and finally write down the interpretation supplied by the science team. Keep those three notes separate. A vivid false-color palette is a way to display information; its legend tells you what that information is.
For a comparison with another orbiter, explore MRO's instrument map. For help finding and citing imagery, use the Mars pictures guide.
Use the mission's archive carefully
The PDS Odyssey archive is the route to instrument data and documentation. Record the product type, observation date and processing version when using a dataset. A mission-wide summary is a starting point; the documentation for the particular product establishes how it can be interpreted.
Odyssey has also supported communications with surface missions. That operational role extends its usefulness beyond its own science measurements. The Mars communications guide explains the relay route, while How Spacecraft Enter Mars Orbit follows the arrival mechanics.
Sources and further reading
Consult NASA's mission record, science overview and instrument descriptions. The ASU THEMIS collection and PDS archive provide observations and documentation for further study. The reading exercises here are suggested workflows.