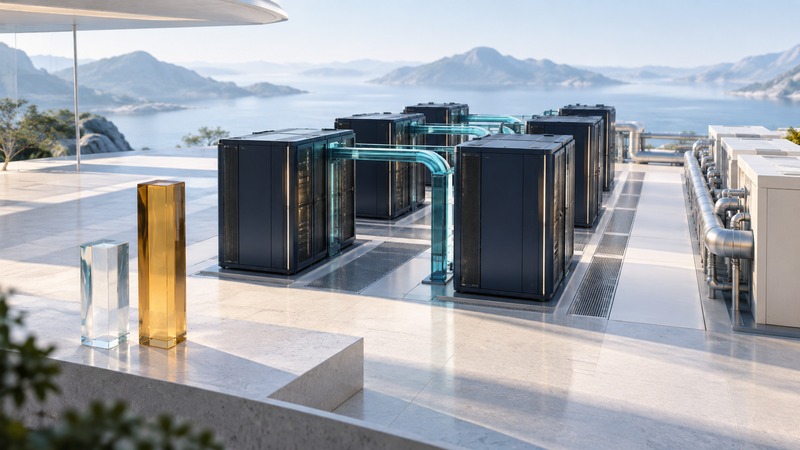
A Linux supercomputer combines many processing resources with software that coordinates computation, data movement and access to the machine. Its value is the scientific or engineering work completed correctly within a useful time and resource budget.
To interpret a claim about speed, identify the system configuration, benchmark, numerical precision, problem size and date. This guide explains those comparisons. For submitting and checking an actual scheduled job, use How a Linux HPC Cluster Runs a Job.
Picture the complete computing system
A compute node contains processors, memory and often accelerators such as GPUs. An interconnect carries messages between nodes. Storage supplies inputs and retains results. Login services, schedulers and management systems let people share those resources. The application and its libraries determine which parts of the system do useful work.
More arithmetic hardware helps when the program can feed it enough suitable work. A calculation may instead wait for memory, communication, file access or a serial portion of the algorithm. An accelerator also needs a compatible implementation and enough device memory; transferring data can consume part of the time saved by faster arithmetic.
Linux provides the operating-system foundation, while the scheduler, MPI implementation, compiler, numerical libraries and application supply other layers. Keep software versions and launch settings with a benchmark result so another researcher can understand what was measured.
Read peak and measured performance separately
The TOP500 field definitions distinguish Rpeak, theoretical peak performance, from Rmax, the maximum achieved LINPACK performance used for ranking. A large Rpeak is a specification; Rmax records a particular benchmark achievement.
TOP500's LINPACK explanation describes a dense linear-equation problem. The result is valuable for comparing that kind of computation, and its scope should travel with the number. A lower score on a different benchmark can be perfectly consistent with the same hardware.
On a small screen, scroll the table sideways to read all columns.
| Evidence | Useful interpretation | Additional check |
|---|---|---|
| Rpeak | Theoretical arithmetic capacity for the stated configuration and precision | What precision and operation-count convention produced it? |
| HPL / Rmax | Measured performance on the specified dense linear algebra benchmark | Which system size, problem and software were measured? |
| HPCG | A complementary benchmark with a different pattern of computation and data access | How closely does that pattern resemble the application? |
| Application run | Elapsed time and correctness for a specified real workload | Were inputs, convergence criteria and output checks equivalent? |
| Performance per watt | Throughput relative to measured electrical power | What components and measurement interval were included? |
The HPCG project presents its benchmark as a complement to HPL. Use complementary measurements to ask better questions about a machine, then test the actual application. A single rank cannot substitute for its performance profile.
Use the AIST example with its date attached
AIST's May 10, 2004 announcement of the AIST Super Cluster (Japanese) described a Linux system supporting grid research, nanotechnology and bioinformatics. That context explains why early Linux clusters mattered: they brought substantial computing and storage resources into a platform researchers could integrate and extend.
For a specific historical measurement, use the TOP500 records for AIST's Grid Technology Research Center and open the named system and list edition. Different subsystems, later expansions and theoretical totals can produce different figures without describing the same benchmark run. Preserve the original unit and configuration before comparing historical announcements.
Compare elapsed time and energy together
Power is the rate of energy use; energy accumulates over time. Include the same components and sampling interval in both measurements. If cooling or other facility loads are excluded, identify that boundary. A Green500 power-measurement tutorial illustrates why a benchmark and power measurement must be tied to a defined run. Consult the rules for the relevant list edition before using a published efficiency result.
Build a comparison that survives scrutiny
- Name the application, input size, numerical precision and correctness requirement.
- Record node and accelerator counts, memory capacity, interconnect, storage and software versions.
- Separate queue delay, setup, calculation and output time. Keep both elapsed service time and the compute-only measurement when relevant.
- Repeat runs under comparable conditions and report variation. Include a slower run if it represents normal behavior.
- Measure resource use over the same boundary and check whether the faster result meets the actual deadline or budget.
For iterative solvers, preserve tolerance and convergence behavior; finishing fewer iterations can change the question being answered. For scaling studies, state whether the problem stayed fixed or grew with the machine. Compare result quality alongside speed.
A useful summary reads like this: “For this input, software configuration and accuracy target, this allocation completed the task in this time.” Keep broader claims within the evidence. The downloadable comparison record captures the fields needed to make that sentence meaningful.
Keep a working record
Download the supercomputer comparison record (plain text). Save a copy and fill in the evidence for your own task.