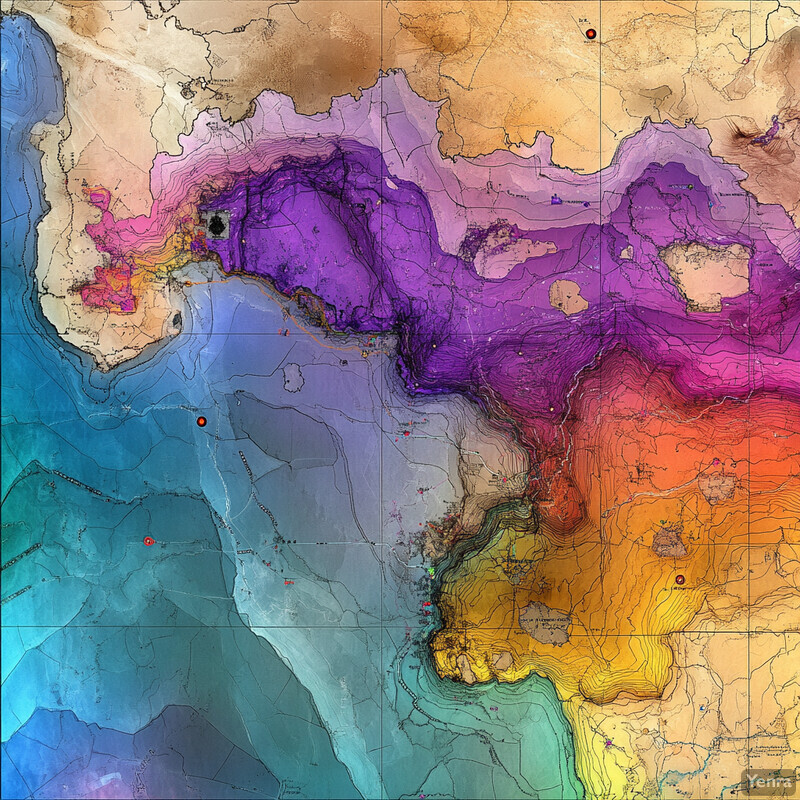
Geochemical Anomaly Detection 2 - Image Index | 20 Ways AI is Advancing Mining Exploration and Resource Estimation Topographic Map of a Valley or Depression: A topographic map of an area, likely created using Geographic Information Systems (GIS) technology. The map is colored in shades of blue, purple, yellow, and orange, which may represent different elevations or landforms. The colors are arranged in a gradient pattern, with the darkest shade at the bottom left corner and gradually lightening towards the top right corner. This suggests that the area depicted is a valley or depression, with the terrain sloping upwards from the center to the edges. The map also features several red dots scattered throughout, which may indicate points of interest or notable locations. Overall, the image provides a clear visual representation of the area's geography and topography.