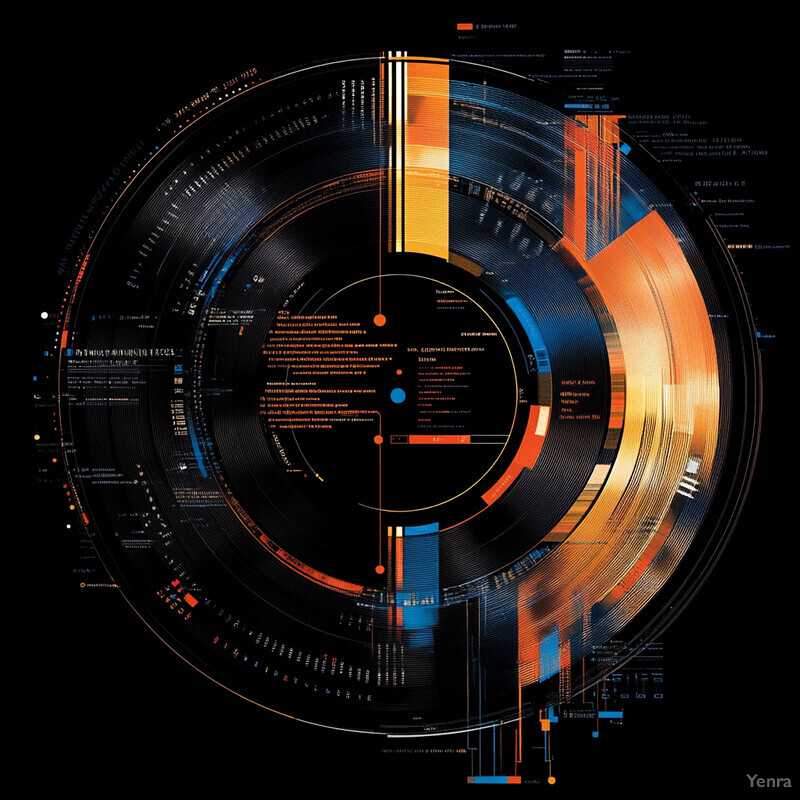
Time to Create 1 - Image Index | Yenra The infographic is a visually striking representation of data, featuring a circular design with concentric circles and a central hub. The image employs a color scheme of orange, blue, gold, black, and white to represent various data points. A subtle grid pattern adds texture and visual interest to the chart. In terms of layout, the infographic follows a standard format with a title in the top-left corner,