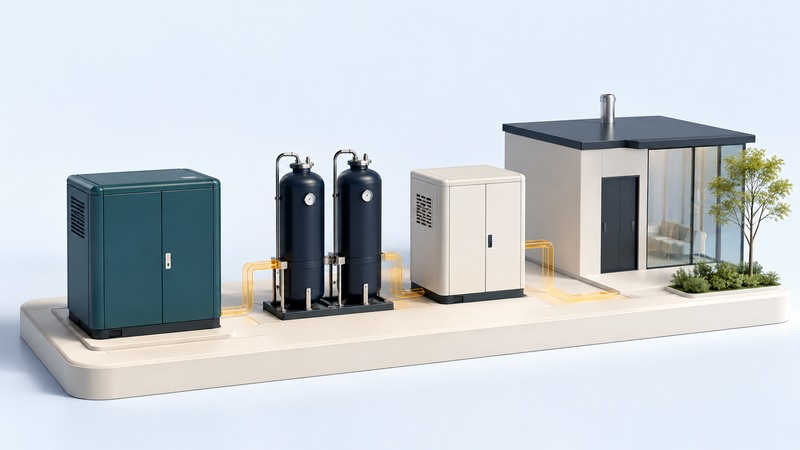
Hydrogen carries energy from a production process to a later use. To evaluate a hydrogen-power proposal, trace the whole chain: production, conditioning, transport or storage, and conversion back to electricity. Keep net delivered power and complete inputs beside any efficiency or emissions claim.
This guide supports project comparison and interpretation. Hydrogen equipment, storage, ventilation and protection systems require qualified design and the applicable approval process.
Follow the inputs through each stage
DOE’s hydrogen-production overview describes multiple pathways. The feedstock and process matter: a kilogram of hydrogen does not by itself identify the energy used or emissions created in producing it.
Electrolysis uses electricity to split water. Its evaluation must include the electricity source, production equipment and other required inputs. Some high-temperature processes also use external heat; record that heat separately when comparing electrical consumption.
On a narrow screen, scroll the table sideways. Keyboard users can focus the table region and use the arrow keys.
| Stage | Quantity or condition to record | Boundary question |
|---|---|---|
| Production | Hydrogen output, electricity/fuel/heat inputs and gas quality | Does the figure cover the whole plant or only the stack? |
| Conditioning and delivery | Compression/liquefaction, transport, storage and losses | Which energy uses and gas losses are included? |
| Power conversion | Net AC output, load range, startup and auxiliary demand | Is the output measured at the point the customer receives it? |
| Service and emissions | Required duration, availability and lifecycle inventory | What alternative service is being compared? |
DOE’s hydrogen delivery program identifies transport, storage and conditioning as important contributors to cost and energy use. Specify what happens between production and the final user even when separate companies provide those services.
Distinguish the power-conversion equipment
A hydrogen fuel cell produces electricity through an electrochemical reaction with oxygen, yielding water and heat. A hydrogen engine or turbine uses combustion. DOE explains that hydrogen combustion can produce nitrogen oxides; the equipment and controls determine the applicable emissions performance.
For electricity comparisons, use net AC output after the system’s own loads and conversion losses. Keep heating-value basis consistent: lower and higher heating values treat the water produced differently. An efficiency figure needs its basis, load point, auxiliary boundary and test conditions.
Useful recovered heat can be valuable when a real demand exists at the available temperature and time. Report it separately from electrical output. The fuel-cell technology guide explains the equipment choices and useful-heat accounting in more detail.
Reproduce a full-chain calculation
Fictional electricity-to-hydrogen-to-electricity cycle: an electrolyzer system consumes 1,000 kWh of AC electricity and produces hydrogen containing 700 kWh on a lower-heating-value basis. Conditioning and storage consume another 60 kWh of electricity. Assume no hydrogen inventory loss or external heat input for this simplified example.
A fuel-cell system converts 45% of the delivered hydrogen’s LHV energy to net AC electricity: 700 × 0.45 = 315 kWh. Complete electricity input is 1,000 + 60 = 1,060 kWh. Electrical round-trip efficiency is 315 ÷ 1,060 = 29.7%, rounded.
Using only the 45% conversion-stage figure would omit hydrogen production and conditioning. If storage losses occur, substitute the hydrogen actually delivered; if external heat is used, retain that input explicitly.
This is an accounting illustration, not a typical efficiency, design target or supplier guarantee. Sandia’s hydrogen-storage chapter discusses the system components and the role of hydrogen in storage applications.
Compare emissions and the required service
For an emissions assessment, define the functional unit, such as one net kWh delivered during a stated duty cycle. Include the relevant production energy, feedstock supply, conditioning, transport and losses. Record the method and assumptions behind electricity emissions rather than assigning a color label as the result.
Separate site emissions from lifecycle emissions and greenhouse gases from local air pollutants. An absence of CO2 at a hydrogen-fuelled device does not establish the entire supply chain’s emissions. Request measured or method-based values for the particular fuel pathway.
Then evaluate the service: startup, usable duration, storage replenishment, backup supply, planned outages, maintenance and site requirements. A less efficient chain could still serve a particular long-duration need; demonstrate that need and compare complete alternatives rather than using efficiency alone as the decision.
Use the evidence sheet with compressed-air storage comparisons and demand timing. Keep operating evidence distinct from announced projects and future performance targets.
Hydrogen power-chain comparison
Hydrogen power-chain comparison — plain-text download. Save a copy and fill it in with your own information. The file includes instructions, assumptions and references so it can be used independently.