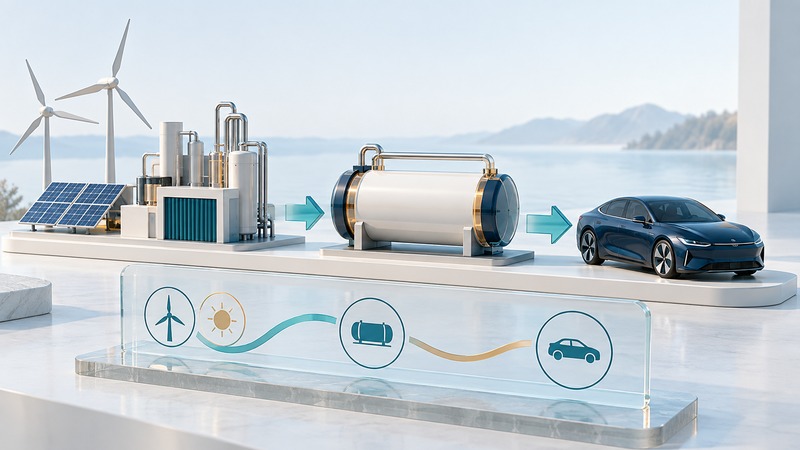
The energy and emissions associated with a hydrogen vehicle depend on how its fuel is made and delivered as well as how efficiently the vehicle uses it. Compare pathways using the same service, units and accounting boundary. A fuel-cell powertrain alone does not identify the upstream emissions of its hydrogen.
Draw the boundary before comparing numbers
DOE's R&D GREET life-cycle assessment model evaluates energy use and environmental impacts across pathways. Its hydrogen life-cycle analysis tutorial explains the importance of production and delivery assumptions. A modeled result belongs to its stated scenario, including geography, electricity supply, technology and data year.
On a narrow screen, scroll the table horizontally. Keyboard users can focus the table and use the arrow keys.
| Boundary | What to include | What to verify |
|---|---|---|
| Well-to-tank | Feedstock and energy supply, fuel production and delivery to the vehicle | Compression, transport, dispensing and losses included in the factor |
| Tank-to-wheel | Vehicle fuel consumption and operational emissions | Test cycle or measured use, distance and vehicle duty |
| Well-to-wheel | The fuel pathway combined with vehicle operation | Consistent fuel quantity and no duplicated upstream stages |
| Vehicle life cycle | Specified vehicle and component production, use and end-of-life stages | Lifetime distance, replacements and the study's allocation choices |
Write the boundary next to the result. A production-only hydrogen factor needs additional information before it represents fuel delivered to a vehicle. A factor that already includes delivery should enter the calculation once.
Convert a delivered-fuel factor into emissions per distance
Fictional comparison: assume a vehicle consumes 1.0 kg of hydrogen per 100 km. Delivered pathway A is assigned an invented factor of 6 kg CO₂-equivalent per kg of hydrogen. Its upstream result is 1.0 × 6 = 6 kg CO₂e per 100 km, or 60 g CO₂e/km.
With the same vehicle consumption and an invented pathway B factor of 12 kg CO₂e/kg, the result becomes 120 g CO₂e/km. Both factors are assumed to include production and delivery. The example excludes vehicle manufacturing and any separately assessed vehicle-use effects.
The calculation shows which assumption changed: the delivered-fuel factor. It is not a ranking of real suppliers. To compare real pathways, obtain documented factors with matching boundaries, emissions metrics and time horizons. If consumption also changes, calculate that effect separately so the reason for the difference remains visible.
Keep energy efficiency and emissions distinct
An energy balance follows energy inputs and useful output; an emissions inventory follows specified releases and their climate characterization. A low-carbon electricity scenario can change the emissions factor without making every conversion stage lossless.
Record energy in consistent units and state whether hydrogen energy is expressed on a lower-heating-value or higher-heating-value basis. Keep electricity used in production, fuel energy delivered and mechanical service distinguishable. For a percentage efficiency, identify both numerator and denominator before comparing studies.
Choose a service appropriate to the question: a comparable passenger journey, vehicle distance under the same duty, or freight movement with stated payload. Comparing a passenger-car test rating with a heavily loaded truck's route result would answer a different question from comparing fuel pathways.
Make the comparison reproducible
Save the source and version for fuel consumption and each pathway factor. Mark measured values, model outputs and assumptions. Recalculate with a second plausible electricity or delivery assumption to see whether the conclusion depends on it. If the result changes substantially, report the range and the responsible input.
Use the fuel-cell vehicle guide for ownership and refueling considerations, and hydrogen energy pathways for wider system context. A useful comparison combines those practical requirements with a transparent full-chain calculation.
Hydrogen pathway comparison
Download the hydrogen pathway comparison (plain text). Save a copy and fill it in with your own evidence. Instructions, units, assumptions and the fictional example are included.