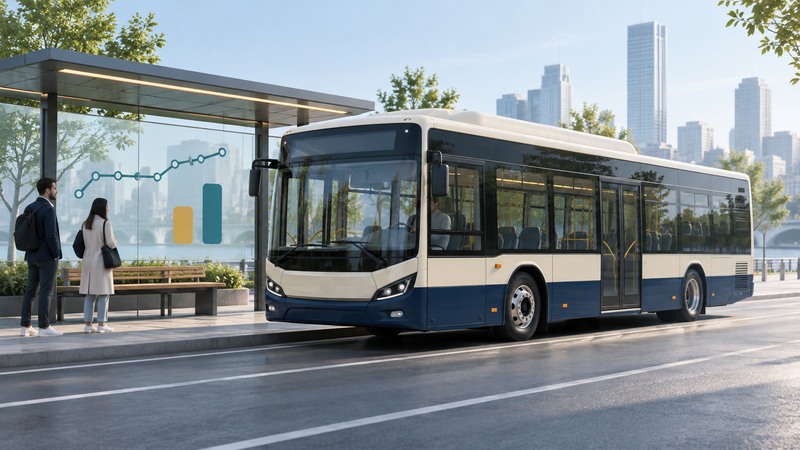
A useful hybrid-bus comparison measures fuel and delivered service on the routes the fleet will operate. Start with the required passenger capacity, duty cycle and availability, then compare exact vehicle configurations under matched conditions.
Fleet planners need route logs, fuel records, maintenance data and the proposed bus specification. Choose the comparison question first: replacing a diesel bus on a particular route, evaluating a pilot fleet, or comparing several propulsion options for a procurement.
Understand what the hybrid system changes
A hybrid bus combines an engine with electric propulsion and energy storage. Regenerative braking can recover part of the vehicle’s deceleration energy for reuse. In a series arrangement an electric motor drives the wheels; a parallel arrangement provides a mechanical engine path as well as electric assistance. Blended systems require their own architecture description.
FTA’s August 2005 Electric Drive Bus Analysis explains these configurations and regenerative braking. Treat its technology survey as historical background. Confirm charging requirements, battery size and engine-off capability for the offered vehicle, especially when comparing conventional hybrids with plug-in hybrids.
Repeated stopping, sustained higher speeds, gradients and heating or cooling loads change the operating problem. An October 2016 ORNL study compared series and parallel buses by simulation across six city drive cycles. Its findings illustrate why cycle and pollutant matter; they provide context for a trial, rather than a performance guarantee for a current fleet.
Build a fair route comparison
On a narrow screen, scroll the table sideways. Keyboard users can focus the table region and use the arrow keys.
| Record | Match or normalize | Interpretation |
|---|---|---|
| Service | Route, distance, speed distribution, stops, grades and passenger loading | Different service assignments can dominate an apparent propulsion difference. |
| Conditions | Season, temperature, heating/cooling use and congestion | Compare similar conditions or explain the adjustment method. |
| Energy | Fuel litres, distance, and external charging kWh where applicable | Use a consistent system boundary and include charging for plug-in buses. |
| Reliability | Scheduled and delivered trips, road calls and downtime reasons | Fuel performance must be read alongside service delivery. |
| Configuration | Bus model, engine, hybrid system, battery, software and vehicle mass | A model name alone leaves important differences unresolved. |
Choose the recording period and exclusions before starting. Keep cancelled trips, substitute buses and missing fuel entries visible. Where possible, rotate comparable buses across assignments and collect enough repeated runs to see the spread. Report the sample size and range alongside the average.
Use the correct fuel denominator
Fictional matched-route result
Over the same 200 km, a diesel bus uses 80 L and a hybrid uses 64 L. Consumption is 40 versus 32 L/100 km. Fuel reduction relative to the diesel is (80 − 64) ÷ 80 × 100 = 20%.
Expressed as economy, the values are 2.5 and 3.125 km/L. The increase in km/L is 25%. Both calculations describe the same invented result, with different denominators. Label the metric before comparing percentages.
For a plug-in hybrid, add measured charging energy and state whether it is measured at the charger input or elsewhere. For an emissions claim, identify the pollutant and whether the evidence covers tailpipe operation or a wider energy supply chain. Fuel use alone leaves those boundaries unresolved.
Connect test evidence to fleet support
Use FTA’s bus-testing report guidance to locate full and partial reports and confirm the tested configuration. Read the operating conditions and changed components before transferring a result to the offered bus. A test report and a local trial answer complementary questions.
Ask maintenance staff to review diagnostic access, training, high-voltage work arrangements, spare parts, warranty exclusions and battery replacement support. Request a plan for keeping service running when specialist parts or technicians are unavailable.
Finish with a decision record showing route suitability, energy results, service availability, support costs and unresolved evidence. Compare proposals over the same operating horizon and disclose assumptions about fuel prices, replacement intervals and residual value. The strongest result is a fleet-specific account of what was measured and what still depends on a supplier commitment.
Hybrid bus route comparison
Hybrid bus route comparison — plain-text download. Save a copy and fill it in with your own information. The file includes instructions, assumptions and references so it can be used independently.