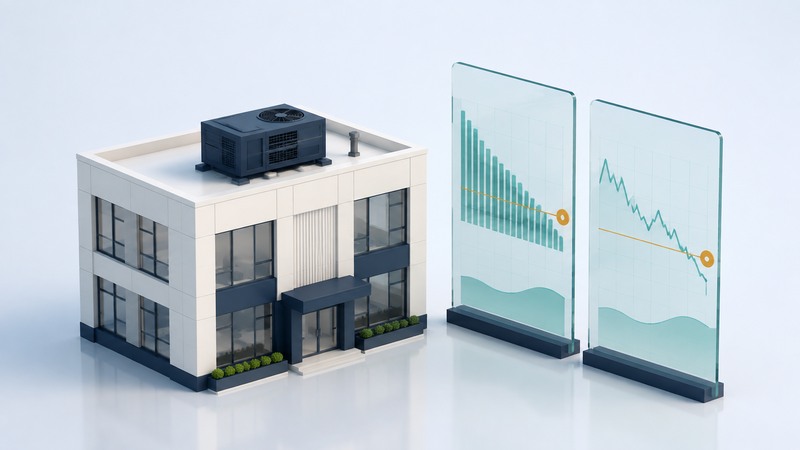
A useful efficiency project delivers the required lighting, heating, cooling or production with less energy. Before comparing proposals, define that service and agree how the result will be measured. A lower bill can reflect a tariff change, milder weather or shorter opening hours as well as better equipment.
This guide helps building owners and facility managers evaluate a proposal. Gather a representative year of bills, available interval data, operating schedules, equipment records and comfort or production requirements. A qualified assessor can then identify the measurements needed for the project.
Define the baseline and service
Write down what is included: one lighting circuit, the cooling plant or the whole building. Record meter locations and units, occupied hours, floor area and any relevant production or weather variables. Save original data and document missing or estimated readings.
DOE’s FEMP measurement and verification guidelines, Version 5.0, provide a formal framework for performance-based projects. Their useful starting principle is to compare baseline and reporting-period consumption with appropriate adjustments. Agree the method before installation, while the original system can still be measured.
On a narrow screen, scroll the table sideways. Keyboard users can focus the table region and use the arrow keys.
| Field | Record before purchase | Use after installation |
|---|---|---|
| Required service | Illumination, temperature, ventilation or production requirements | Check that the required service is still delivered. |
| Boundary | Equipment, meters and interacting systems included | Use the same boundary for claimed savings. |
| Operating conditions | Hours, occupancy, weather or output as relevant | Document changes and agreed adjustments. |
| Evidence and responsibility | Measured inputs, estimates, uncertainty and responsible party | Reproduce the calculation and resolve discrepancies. |
If a proposal changes several systems, ask how their interactions are handled. For example, a lighting change can also affect heating and cooling loads. A whole-building estimate and separate equipment estimates need reconciliation before their savings are added.
Choose proportionate measurement
FEMP describes four M&V approaches: measuring key parameters with documented estimates for others, measuring all relevant system parameters, analyzing whole-building consumption, or using calibrated simulation. The choice depends on the project, available data and uncertainty; more meters alone do not establish a better comparison.
For a straightforward lighting replacement, measured power and credible operating hours may be enough to estimate consumption. For a plant with variable load, spot measurements can miss important operating states. Ask the assessor to justify the measurement period and how representative conditions will be captured.
ENERGY STAR’s energy use intensity explanation shows how annual energy divided by floor area supports benchmarking. Use the same site/source basis and units. A benchmark can flag a building for investigation; isolating a particular retrofit’s savings requires its own comparison.
Work through an adjusted comparison
Fictional annual lighting project: the original installation used 12 kW for 3,000 hours, or 36,000 kWh. The new installation uses 8 kW. Opening hours increase to 3,300 in the reporting year, while the required illumination is maintained.
Using reporting-year hours for both systems gives an adjusted baseline of 12 × 3,300 = 39,600 kWh. The new installation uses 8 × 3,300 = 26,400 kWh. Estimated savings are 13,200 kWh, or one-third of the adjusted baseline. Simply subtracting this year’s use from last year’s 36,000 kWh would give 9,600 kWh and mix the equipment change with the schedule change.
At a fictional constant energy rate of $0.15/kWh, the energy saving is $1,980 per year. Subtract $180 of added annual service expense: net benefit $1,800. A $9,000 installed project has a simple payback of five years under these assumptions.
This illustration excludes financing, demand charges, taxes, changing tariffs, degradation and heating/cooling interactions. Keep those items separate in a real assessment; compare lifetime cash flows when timing and replacements materially affect the decision.
Specify acceptance and follow-up
Ask each bidder to provide installed scope, commissioning checks, required service levels, measurement plan, responsibilities, maintenance cost and a lower-savings case. Decide who owns the data and what happens when measured performance falls short.
After installation, check both energy use and service. Investigate a discrepancy by checking meter boundaries, changed schedules, control overrides, failed sensors and maintenance records before revising the baseline. Preserve the agreed assumptions and explain each adjustment.
For household priorities, use the home conservation guide. For interval data and tariffs, see smart electric meters. These are useful inputs to a project brief; the final comparison should remain reproducible from the building’s own evidence.
Efficiency project and verification brief
Efficiency project and verification brief — plain-text download. Save a copy and fill it in with your own information. The file includes instructions, assumptions and references so it can be used independently.