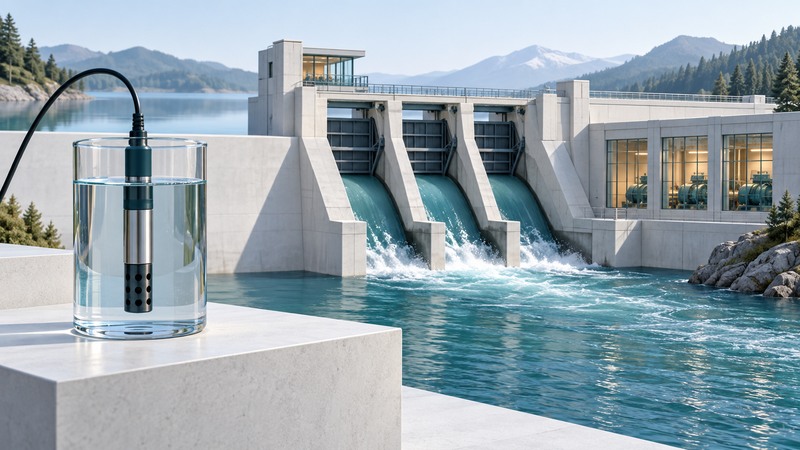
A dissolved-oxygen result becomes useful when it includes the sampling location, time, temperature and quality-control context. To evaluate aeration at a hydropower dam, compare like conditions and ask whether the measurements represent the water and aquatic life the project is intended to protect.
This guide helps readers interpret monitoring reports. Use the site’s approved monitoring plan and trained personnel for field measurements; dam access and water-sampling procedures are site-specific.
Distinguish concentration from saturation
Dissolved oxygen (DO) is molecular oxygen present in water, commonly reported in milligrams per litre (mg/L). Its availability changes with processes including mixing, biological activity and temperature. USGS’s dissolved-oxygen explanation describes why daily, seasonal and location differences matter.
Percent saturation compares measured concentration with an equilibrium concentration for the relevant water conditions. USGS DOTABLES calculates oxygen solubility using temperature, barometric pressure and salinity or specific conductance. Record those inputs and check that they are within the tool’s documented range.
Fictional saturation comparison
A measured concentration of 6 mg/L, with an assumed equilibrium value of 8 mg/L, gives 6 ÷ 8 × 100 = 75% saturation. A second sample with 8 mg/L and an assumed equilibrium value of 10 mg/L gives 80%.
The equilibrium values are invented for arithmetic, not lookup values for stated water conditions. Report both concentration and saturation with their supporting conditions; either number on its own loses context.
Read the measurement record
On a narrow screen, scroll the table sideways. Keyboard users can focus the table region and use the arrow keys.
| Item | Look for | Reason |
|---|---|---|
| Location and depth | Mapped station, depth and position relative to the outflow | A mixed tailrace sample and a local plume can represent different conditions. |
| Time and operation | Timestamp, flow, unit operation and aeration status | Operating changes and daily cycles affect comparability. |
| Water conditions | DO in mg/L, temperature, and saturation inputs where used | Concentration and saturation answer related but distinct questions. |
| Quality assurance | Instrument identification, calibration/check records, fouling and corrections | Sensor drift and field conditions can alter a result. |
| Coverage | Sampling interval, missing periods and spatial coverage | An average may hide short low-oxygen events or unmeasured areas. |
Start by finding the report’s monitoring objective and station map. Then trace a reported value to its time series and quality flags. Where a graph has gaps, ask whether the missing interval overlaps a critical operating or weather condition.
Evaluate the claim and the other gases
Aeration or oxygenation can change oxygen availability in discharged water. A useful evaluation shows the operating conditions, measurement locations, comparison method and persistence of the effect downstream. Ask for repeated observations under comparable flow and temperature, with instrument checks included.
USGS’s March 2026 report on total dissolved-gas monitoring below Youghiogheny Dam explains why gas monitoring can accompany efforts to improve oxygen conditions. Its methods describe a specific Pennsylvania tailrace and data collection through the report’s stated period. Use the example to ask about total dissolved gas where relevant to the site.
DO measures oxygen; total dissolved gas assesses the combined gas condition. Increased oxygen and a satisfactory total-gas condition require their own evidence. Ask which parameters the site’s assessment monitors and why those parameters were selected.
Apply the relevant criterion and close the review
Find the criterion applicable to the waterbody, designated use, season and monitoring location. Read whether it concerns a minimum, an average or another statistic, and obtain the current requirement from the responsible agency or project documents. A single universal oxygen threshold would omit these distinctions.
A constructive review states: where and when the water was measured; whether the data passed quality checks; which criterion or project objective was used; and how much of the relevant operating range was covered. If a report contains only an average, request the distribution and low-value periods. If aeration and flow changed together, ask how the assessment separates their effects.
Use the record below to turn missing context into specific follow-up requests. Keep the interpretation tied to the monitored reach and period.
Dissolved-oxygen report review
Dissolved-oxygen report review — plain-text download. Save a copy and fill it in with your own information. The file includes instructions, assumptions and references so it can be used independently.