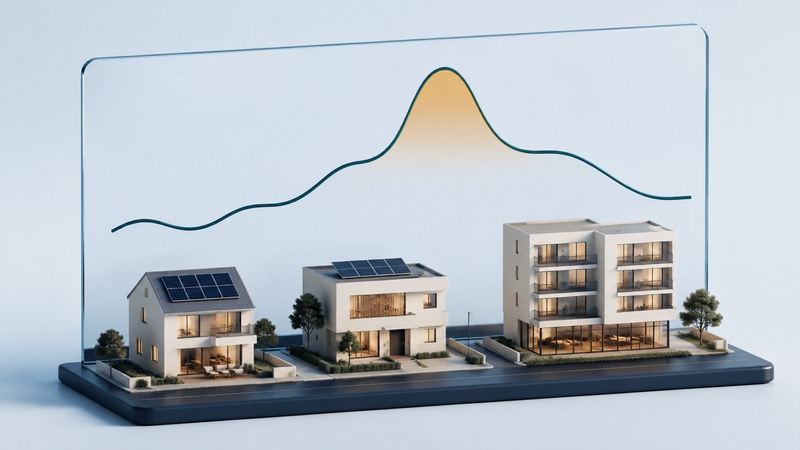
An electricity-demand forecast needs both a quantity and a clock. Annual energy describes how much electricity is used; peak demand describes the highest power requirement over a specified interval. Two regions with equal annual consumption can need very different resources at their busiest hours.
When reading a utility plan, gather its geographic boundary, forecast year, interval length, demand definition and assumptions. Keep the base forecast separate from scenarios for unusual weather or uncertain new loads.
Read the axes and boundary
A megawatt, MW, is power. A megawatt-hour, MWh, is energy: 1 MW sustained for one hour supplies 1 MWh. A load curve plots power against time. The area beneath it gives energy over the displayed period.
EIA’s analysis of hourly demand patterns, published in 2020 using 2015–2019 observations, illustrates how daily shape varies with season, weather and region. Use those patterns as context and obtain current regional data for a present decision.
Check whether a graph shows customer consumption, grid-supplied load after behind-the-meter generation, or net load after a stated generation category is subtracted. Note imports, losses and time zone where applicable. A change in the definition can look like demand growth even when customer use has not changed.
On a narrow screen, scroll the table sideways. Keyboard users can focus the table region and use the arrow keys.
| Field | Question | Reason |
|---|---|---|
| Time resolution | Annual energy, hourly average or shorter peak? | Averages can hide short periods of high demand. |
| Boundary | Which region, customers and behind-the-meter resources? | Different boundaries produce different load totals. |
| Assumptions | Weather, economic activity, electrification and new connections? | The forecast depends on which changes actually occur. |
| Uncertainty | Central, high/low and extreme-condition cases? | One forecast value cannot describe the full risk. |
For public operating data, EIA’s Hourly Electric Grid Monitor provides regional views. Read its data definitions and timestamps before comparing it with a utility’s forecast.
Calculate energy and load factor
Fictional 24-hour system: demand is 50 MW for eight hours, 80 MW for eight hours, 100 MW for four hours and 60 MW for four hours.
Daily energy is (50 × 8) + (80 × 8) + (100 × 4) + (60 × 4) = 1,680 MWh. Average demand is 1,680 ÷ 24 = 70 MW. Peak demand is 100 MW. Load factor for this day is average divided by peak: 70 ÷ 100 = 70%.
Suppose 10 MW of flexible demand moves from each of the four 100 MW hours to four of the 50 MW hours. Energy remains 1,680 MWh, while the peak falls to 90 MW. The new load factor is 70 ÷ 90 = 77.8%, rounded.
The shift changes timing, not total energy in this illustration. A real process may use different energy after rescheduling. Check rebound consumption, operating constraints and whether the action is dependable during the critical period.
Match resources to the required hours
NERC’s long-term assessments examine projected demand, supply and transmission adequacy. Read the relevant assessment area and assumptions together; a continent-wide growth headline does not establish a local shortage.
Compare resources by availability at the hours of need, not just nameplate MW. The assessment must account for outages, fuel availability, weather-dependent output, storage state and duration, demand-response performance and import deliverability. Resources exposed to the same weather can fail or decline together.
For a fictional 10 MW need lasting four hours, storage would have to deliver 40 MWh at the required power before considering charging, reserves or losses. A 10 MW label without usable duration cannot resolve that need. Generation and imports likewise require evidence of availability when the demand occurs.
Turn a forecast into questions
Ask how proposed large loads are screened: announced, contracted, connected or operating. Check expected start dates, ramp-up, duty cycles and whether the forecast already includes efficiency or customer generation. Avoid adding a new-load estimate twice.
Request a comparison of forecast and actual demand for previous years, plus explanations of material differences. For a new resource plan, ask which options address the identified hours and constraints, when they can enter service and what happens if demand arrives sooner.
Use interval meter data for a building-level analysis and the transmission guide for delivery constraints. The worksheet helps retain the definitions and reproduce the arithmetic before judging the plan.
Electricity demand and forecast worksheet
Electricity demand and forecast worksheet — plain-text download. Save a copy and fill it in with your own information. The file includes instructions, assumptions and references so it can be used independently.