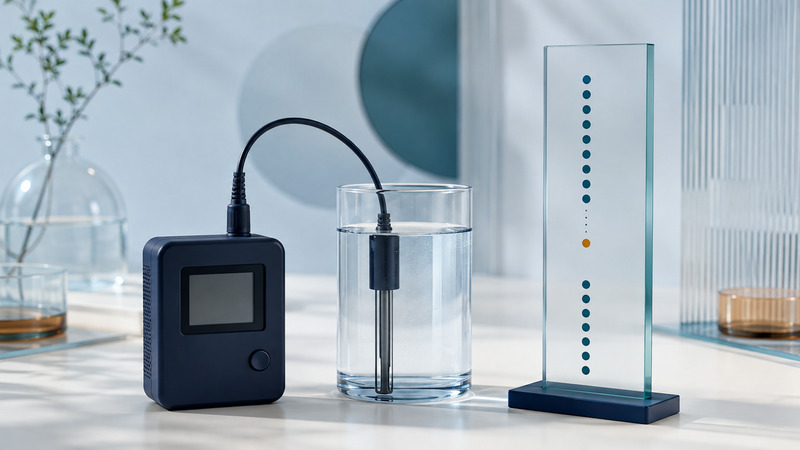
A data logger turns sensor readings into a record you can inspect later. The hard part is deciding what that record must preserve. A perfectly tidy file can still miss a short event, use the wrong units, or contain readings from a poorly placed sensor. Plan the measurement before choosing the storage interval.
Begin with a measurable question
“Monitor temperature” leaves too much unspecified. A more useful question is: “How does the temperature at this shaded location vary during the school day, and are there changes lasting at least several minutes?” Name the quantity, location, duration, smallest useful change, and shortest event of interest. That defines what the sensor and logger must accomplish together.
On a small screen, scroll the table sideways to read all columns.
| Specification | Meaning for the measurement | Question to ask |
|---|---|---|
| Range | The interval the sensor and input can measure under stated conditions. | Will expected values and plausible excursions fit without clipping? |
| Resolution | The smallest discernible change in indication. | Does the extra decimal place represent useful information or just display detail? |
| Accuracy specification | A stated performance limit under defined conditions, sometimes including several error terms. | Does it include the probe, logger, operating temperature, and required range? |
| Response time | How quickly the sensor responds to a change in what it measures. | Can the probe follow the events the study needs to see? |
A display showing 20.01°C does not establish an error of only 0.01°C. The international metrology vocabulary distinguishes resolution from measurement accuracy. Read the conditions attached to specifications, including excitation, warm-up, cable effects, and environmental limits where relevant.
Placement is part of the method. A temperature sensor touching a sunlit wall is answering a different question from a shielded sensor measuring nearby air. A probe with a protective sheath may respond more slowly than an exposed sensing element. Photograph the placement, record immersion or mounting details, and check the manufacturer's instructions for the actual probe.
Sampling, storing, and transmitting are different clocks
A logger might read a sensor every second, save a one-minute average, and transmit an hourly file. These are three separate intervals. An average suppresses some variation; it does not preserve the maximum instantaneous reading. Campbell Scientific's measurement and storage overview describes programmable sampling and stored summaries such as minima, maxima, and averages.
If brief excursions matter, choose a suitable sampling interval and retain the statistic that answers the question, together with its window definition and valid observation count. An average formed from 60 readings is not equivalent to one formed from two after a connection failure. Saving every second cannot recover a fast temperature change that a slow probe never followed.
For changing electrical signals, inadequate sampling can make a high-frequency signal appear to vary at a lower frequency: aliasing. Band-limited sampling requires a rate greater than twice the highest frequency retained, with a practical margin and appropriate filtering. This is not a universal “two readings per event” rule. NI's guide to bandwidth, sampling, and aliasing explains the distinction and antialias filtering before conversion.
Store an unambiguous timestamp with a time-zone offset or UTC marker, and state whether it marks an instantaneous reading or the beginning or end of a summary window. A repeated local time during a daylight-saving change can otherwise look like a duplicate. Record clock synchronization and resets; a logger's clock can drift even when its temperature channel works correctly.
A missing reading must stay visible
Invented teaching dataset: a room-temperature logger is scheduled once per minute from 12:00 through 12:05 UTC on September 1, 2026. Six observations are expected, including both endpoints. The 12:03 row is retained with a blank value and a missing status.
On a small screen, scroll the table sideways to read all columns.
| UTC time | Temperature (°C) | Status |
|---|---|---|
| 12:00 | 20.0 | ok |
| 12:01 | 20.2 | ok |
| 12:02 | 20.4 | ok |
| 12:03 | Blank | missing |
| 12:04 | 20.8 | ok |
| 12:05 | 21.0 | ok |
The five valid readings sum to 102.4°C, giving an observed-reading mean of 20.48°C. Completeness is 5 ÷ 6 = 83.33%. These are descriptive checks on the records received, not proof of the temperature throughout the interval. The observed minimum is 20.0°C and maximum is 21.0°C; the true extrema could have occurred between readings.
Replacing the blank with zero would produce 17.07°C after rounding, an artificial result. Linear interpolation would instead insert 20.6°C and produce 20.50°C, but that is an estimate based on a smooth-change assumption. Neither value should silently enter the raw record. For irregular intervals, a simple arithmetic mean is also not automatically a time-weighted mean.
Download the fictional temperature data (CSV) and a measurement-plan worksheet (CSV). The e-science guide uses this same dataset in a small project that reproduces the valid-count, mean, and completeness calculations.
Run a short trial before the long deployment
Check the entire chain with a short trial: sensor connection, configured units, recorded timestamps, export format, power interruption behavior, available storage, and the handling of missing or out-of-range values. Download and open a file before relying on unattended collection. A screen showing the right value does not prove the stored column is correct.
Compare readings with an appropriate reference over the range that matters. Keep the reference's uncertainty and the conditions of comparison. Calibration establishes a relationship between indications and reference values; adjustment changes the measuring system. They are distinct operations in the JCGM definition of calibration. A quick side-by-side check is useful, but it is not automatically a full calibration.
After recovery, inspect timestamp spacing, duplicate records, gaps, flat lines, jumps, and values at input limits before making a polished chart. Compare pre-run and post-run checks where drift matters. Choose recalibration intervals using use, environment, performance history, and applicable requirements; NIST does not prescribe one universal interval. Preserve the original export and document corrections in a separate analysis step.
Related resources
- Reproduce this temperature analysis from a downloadable project
- Turn a research question into a testable experiment
- Accuracy, precision, and repeatability in another measurement workflow
- Explore all science resources
Researched and updated September 6, 2026. Consult the linked primary sources for methods, evidence, and limitations.