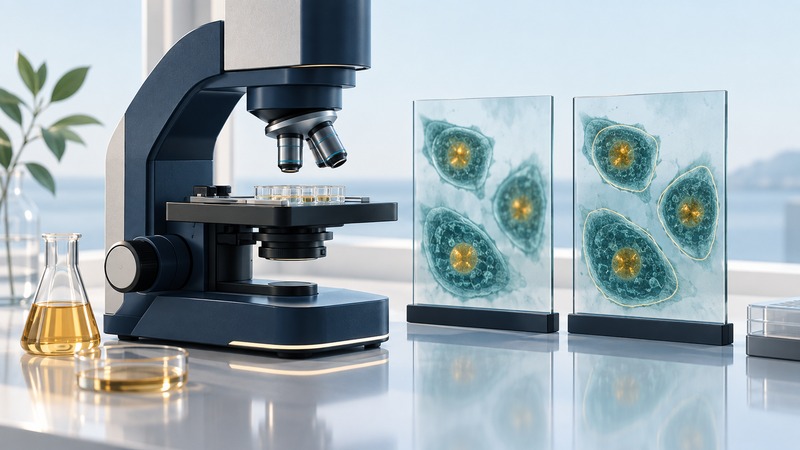
Cell imaging turns visible features into measurements: cell counts, shape, marker intensity, location or changes over time. A useful result starts with a biological question and a defined measurement rule. This guide helps students and researchers discuss a study with an imaging facility and review its output; the facility's validated procedures govern specimen handling and instrument operation.
Choose the approach around the question
| Question | Possible approach | Key tradeoff |
|---|---|---|
| Where is a marker inside a cell? | Microscopy with appropriate labeling and image analysis. | Spatial detail depends on optics, sampling, background and segmentation. |
| How do individual cells move or change? | Live-cell time-lapse imaging. | Observation itself can affect the sample; timing and environmental control matter. |
| How common is a marker-defined population? | Conventional flow cytometry or an imaging-based count. | Flow measurements and images provide different information; sample preparation must suit the cells. |
| Which treatments alter a phenotype? | High-content imaging across many wells or conditions. | Consistent controls, acquisition and analysis are essential across the experiment. |
Conventional flow cytometry records signals from cells or particles passing an interrogation point, as described in Thermo Fisher's flow-cytometry introduction. Imaging provides spatial information that may be central to the question. Imaging flow cytometry combines aspects of both; choose from the actual instrument capabilities.
Define the measurement before collecting images
Write a sentence such as “compare the fraction of cells with nuclear marker signal above a prespecified threshold after treatment.” Then define the biological unit, time point, cell identity, readout and control condition. A thousand cells from one culture provide within-sample information; independent cultures or specimens are needed to assess biological replication.
The Assay Guidance Manual's introductory imaging chapter connects assay development with image acquisition and analysis. Agree on suitable positive and negative controls, label specificity, signal range and acquisition settings. Include a way to detect unwanted fluorescence, focus failures and cell loss. Set exclusion rules before comparing treatment groups.
Distribute conditions across plates and acquisition order so treatment is separable from a processing batch. Keep the original images and metadata: sample identity, preparation, channels, exposure, objective, pixel scale and time point. A bright display can aid viewing, while quantitative comparisons require a consistent relationship between recorded values and the measurement.
Inspect the boundaries before trusting the numbers
Segmentation is the rule that separates objects such as nuclei and cells from the background. A merged pair can count as one cell; a fragmented nucleus can count as several. Both errors affect downstream intensity and shape measurements. Overlay detected outlines on representative original images from every condition, including crowded fields and weak signals.
The advanced Assay Guidance Manual chapter explains controls, illumination effects, image analysis and normalization. Use a consistent analysis procedure and document software versions, parameters and corrections. If an algorithm or trained model needs adjustment, test it across the full range of samples before using the resulting comparison.
For hands-on learning, CellProfiler's official tutorials include beginner segmentation and quality-control exercises. Run the supplied example first, then inspect whether the same rules work on your images. Sample pipelines are starting points; the visual check is how you discover that a different cell shape or background needs attention.
Keep cell counts and percentages together
What a usable report should contain
- The question, sample sheet, independent replicates, controls and batch layout.
- Representative original images with scale information and segmentation overlays.
- Object counts, exclusion reasons and the distributions behind summary values.
- Analysis software, version, settings and any trained-model or preprocessing details.
- The biological comparison, effect estimate, uncertainty and a plan for independent confirmation.
Download the cell-imaging review worksheet to record these details alongside the fictional counting example. If the result changes when a plausible threshold changes slightly, report that sensitivity and resolve the ambiguity before treating the measurement as decisive.
Research measurements establish evidence in the tested system. A clinical diagnostic use requires validation for its intended patients, specimens and decision. When discussing a promising cell phenotype, state what was observed and which subsequent experiment would test its proposed meaning.