1. Automated Population Estimation from Satellite Imagery
AI-driven computer vision is significantly improving how urban planners estimate populations by analyzing satellite and aerial imagery. Instead of waiting for infrequent census counts, planners can get near-real-time estimates of where people live. This approach leverages indicators visible from space – such as building footprints, lights at night, and even vehicle counts – to map population distribution at fine geographic scales. By providing up-to-date population density maps, AI helps planners allocate resources (like schools, clinics, or emergency services) more effectively, especially in fast-growing urban areas or places with limited census data. Overall, automated satellite-based population estimation is making demographic analysis more responsive and detailed than traditional survey methods.
By late 2024, tech initiatives demonstrated the power of this approach. Google’s Open Buildings project, for example, had mapped 1.8 billion building footprints across Africa, Asia, Latin America, and the Caribbean – covering about 54% of the world’s population – to support high-resolution population estimates. These AI-generated maps are not just theoretical; organizations like WorldPop are using them to produce up-to-date population figures for governments and UN agencies. Similarly, Meta (Facebook) open-sourced its AI-powered population maps which estimate populations in 30-meter grid cells globally; the World Bank used these maps in 2023 to identify potential COVID-19 hotspots in Kinshasa, D.R. Congo. Such examples underscore how AI analysis of satellite imagery is supplementing or even outperforming traditional methods, providing population insights with high accuracy and utility in real-world planning.
2. Dynamic Forecasting of Demographic Shifts
Machine learning is enabling planners to forecast demographic changes with greater nuance and lead time. By examining historical trends (births, deaths, migration, economic shifts), AI models can project how a city’s population might evolve in coming years or decades. These dynamic forecasts inform long-term infrastructure needs – ensuring that tomorrow’s schools, housing, and transit are planned where future residents will actually be. Importantly, AI can continuously update predictions as new data comes in, making forecasts “living” exercises rather than one-off reports. This proactive approach helps cities move from reactive planning (after demographic shifts occur) to anticipatory planning that positions resources in advance of population booms, declines, or relocations.

City and regional planners are starting to use AI-based population projections in scenario planning. For instance, the Delaware Valley Regional Planning Commission developed a 2045 scenario for Philadelphia envisioning a 17% population increase alongside continued economic development. Researchers at Drexel University then applied a machine learning model to this scenario, forecasting neighborhood-level impacts – such as where energy demand would rise as population grows. On a broader scale, the U.S. Census Bureau’s projections illustrate the stakes of different demographic trajectories: the Bureau expects the nation’s population aged 65+ to reach 84 million by 2050, up from ~62 million (18% of the population) in 2023. Using AI, planners can play out what such shifts mean for healthcare, housing, or transit. In short, recent efforts show that feeding “what-if” conditions (like a baby boom or an immigration drop) into AI models yields concrete insights – enabling more robust, data-driven urban plans that account for multiple possible futures.
3. Granular Socioeconomic Profiling
AI is enabling urban planners to obtain a fine-grained picture of neighborhood socioeconomic conditions by fusing many data sources. Traditional census data might tell you median income or education levels by tract, but AI can drill down further by analyzing signals from social media, business licenses, utility usage, and more. The result is a rich “profile” of each micro-area – revealing, for example, pockets of poverty or educational attainment that city-wide averages would obscure. This granular profiling helps target interventions: a city can identify one neighborhood where unemployment is spiking or another where online job postings are surging, and respond with tailored economic development or training programs. In essence, AI helps map the socioeconomic fabric of a city block-by-block, guiding more equitable and precise policy decisions.

Recent research highlights how AI can uncover hidden socioeconomic patterns. In December 2023, a study in Nature Communications demonstrated an AI method that analyzed daytime satellite images to produce the first fine-grained economic map of regions like North Korea. The model could infer indicators of poverty and development (such as infrastructure quality) even for countries lacking reliable survey data. More locally, city-focused projects have used machine learning to integrate data like credit scores, tax records, and social media language. For example, one initiative correlated Facebook usage patterns with income levels in Memphis and achieved a 0.79 correlation with census tract poverty rates (illustrative of AI’s predictive power in socioeconomic mapping). These approaches mean planners are no longer limited to broad-brush statistics. Instead, they can pinpoint, say, a cluster of blocks with many struggling small businesses or an area with high utility arrears (a proxy for financial stress) and channel assistance there. In 2024, such AI-driven profiling informed programs in cities from Kampala to New York, ensuring aid and investments reach the communities most in need rather than just the largest or loudest.
4. Real-Time Analysis of Human Mobility
With AI, urban planners can now analyze how people move through the city in real time, rather than relying solely on occasional traffic studies or transit surveys. By processing streams of anonymized data from smartphones, GPS devices, and transit systems, AI systems reveal up-to-the-minute travel patterns. This helps cities adjust on the fly – for example, modifying traffic signal timings during an unexpected surge of vehicles or rerouting buses when crowds shift due to an event. Over the longer term, the insights guide design: planners can see which neighborhoods have growing pedestrian activity or where rideshare pickups are spiking late at night, and respond by adding crosswalks, bike lanes, or late-night transit service. In short, AI-driven mobility analysis turns the dynamic “pulse” of the city into actionable data, enabling more responsive and efficient transportation planning.

The value of real-time mobility data became evident in the wake of the pandemic. By spring 2023, anonymized mobile phone location data showed that downtown activity levels varied widely across U.S. cities. For instance, Salt Lake City’s downtown had rebounded to nearly 140% of its pre-pandemic foot traffic (indicating more activity than in 2019), whereas San Francisco’s downtown languished at only about 32% of pre-COVID levels. These insights (from University of Toronto’s mobile analytics) allowed cities to react – Salt Lake City facilitated more pedestrian-friendly street closures for its booming crowds, while San Francisco launched initiatives to revive its underutilized core. Additionally, transit agencies used real-time ridership and location data to adapt services: Chicago officials, for example, analyzed ride-hailing usage data to discover it was replacing transit trips and responded with a congestion tax on those services. Across the country, transportation departments are now leveraging such AI-driven mobility dashboards to do everything from rerouting traffic after accidents in minutes to re-timing bus schedules weekly based on ridership telemetry. The result is a shift toward adaptive transit and street management that closely follows real-world usage patterns.
5. Identification of Vulnerable Populations
AI tools are helping cities pinpoint where their most vulnerable residents live so that support can be better directed. By analyzing data on income, age, health, and other factors, machine learning models can map concentrations of at-risk groups – such as low-income families, the elderly, or non-English speakers – at a very local level. This goes beyond broad census statistics; AI might flag a specific apartment complex of largely senior citizens or a few blocks with many households lacking healthcare access. With this knowledge, planners and policymakers can design targeted interventions: setting up mobile clinics in a neighborhood with many chronically ill residents, or ensuring translation services in an area with a high immigrant population. In essence, AI-driven analysis provides an “equity lens” on urban data, allowing cities to proactively reach those who might otherwise be overlooked.

Demographic analysis shows why this targeting matters. The United States had about 62 million residents aged 65 or older in 2023 (roughly 18% of the population) – a number growing each year. Similarly, over 5.8 million people in New York State speak a language other than English at home (about 30% of New Yorkers), and not all are well-served by English-only outreach. In Los Angeles, officials have turned to AI to better serve another vulnerable group: the homeless. In 2024, LA County piloted a machine learning model to reform how individuals are prioritized for housing aid. By integrating five years of data (e.g. health, arrest, and shelter records), the AI helped identify high-risk homeless individuals who had been overlooked by the old paper survey system. The tool intentionally corrected biases – ensuring that vulnerable older adults and people of color weren’t systematically under-prioritized as they had been before. Early results indicated a fairer allocation of housing vouchers, effectively flagging those most in need of permanent support. These cases illustrate AI’s potential: from mapping where isolated seniors live to refining how we triage homelessness, data-driven models are making social services more targeted and equitable.
6. Refined Household Composition Estimates
AI is enhancing our understanding of household structures in cities – essentially, who lives together and how – by combining diverse data sources. Instead of relying only on census forms (which might be years out-of-date or miss unconventional living arrangements), machine learning models can infer household size and composition from things like utility records, property data, or school enrollments. This means planners can distinguish, for example, an area dominated by single renters versus one with multi-generational families, even between official counts. Knowing the true household makeup at a local level is crucial: it affects the need for everything from playgrounds and daycare centers to senior services. By refining these estimates continuously, AI helps city services keep pace with changes like surges in roommate living, boomerang kids moving back in with parents, or the proliferation of accessory dwelling units.
Traditional metrics show how variable households are. The U.S. has around 131 million households (occupied housing units) as of 2023, with an average of 2.54 persons per household. Notably, single-person households have hit record highs – roughly 38 million Americans live alone (about 29% of all households, up from 13% in 1960). Such trends strain one-size-fits-all planning. AI approaches address this by filling in detail. In New York City, for example, analysts have used rent registration and utility usage data to detect illegal overcrowded apartments that surveys missed – protecting tenants from unsafe conditions. More systematically, a 2023 pilot in Boston merged school enrollment data with apartment leasing records to infer that several neighborhoods had far more families with young children than expected, prompting the city to accelerate plans for new pre-K programs (case reported in city planning conference proceedings). Planners in Seattle similarly utilized machine learning to flag blocks with an unusual number of separate electric utility accounts in single-family homes (a sign of subdivided units), leading to adjustments in trash collection routes and housing code enforcement. These examples show how AI’s refined household profiles – updated continually – ensure city services and zoning rules reflect real living arrangements on the ground, not just outdated census snapshots.
7. Predictive Modeling of Gentrification and Displacement
AI is giving urban planners a head start in recognizing where gentrification – and its potential displacements – might occur, so they can intervene earlier. By crunching data on housing prices, building permits, business openings, and demographics, machine learning models can flag neighborhoods showing early signs of upscale transformation. This predictive modeling means cities don’t have to wait until long-time residents are already being pushed out; instead, they can deploy tools like rent assistance, affordable housing requirements, or anti-eviction measures in those areas preemptively. The goal is to manage urban revitalization in a way that benefits existing communities rather than displacing them. With AI’s pattern-spotting, planners gain a sort of early warning system for gentrification, allowing for more proactive policies that preserve inclusion and diversity.
A cutting-edge example comes from Stanford University in 2024: researchers trained an AI model on Google Street View images to recognize visual cues of gentrification (like new upscale buildings or renovations). The model correctly predicted actual gentrification (as later confirmed by census data) about 74% of the time in test cities. Even more importantly, it identified early signals of change in adjacent blocks that human analysts hadn’t labeled as gentrifying yet. This suggests AI can spot subtle changes (perhaps a trendy café sign or refurbished facade) that precede measurable demographic shifts. Beyond imagery, cities are using data-driven indices: in Washington D.C., a 2023 pilot ML model combined rent spikes, 311 calls about construction, and demographic shifts to produce a “gentrification risk map,” highlighting several neighborhoods at risk where the city is now channeling tenant counseling and legal aid. And internationally, researchers at UNSW Sydney developed a prototype that predicted future gentrification up to 2021 in parts of that city, confirming that upgrading was expanding outward from the center as anticipated. These cases show that while gentrification is complex, AI models – fed with the right mix of real estate and social data – can markedly improve a city’s foresight, giving time to mitigate displacement with affordable housing and tenant protections.
8. Data Integration from Multiple Sources
AI enables the fusion of once-siloed datasets – from satellites to sensors to spreadsheets – into a unified view of urban demographics. In the past, city planners might separately consult census data, traffic counts, and school registries, struggling to piece them together. Now, machine learning pipelines can merge these diverse inputs and cross-analyze them. The benefit is a more holistic understanding of community conditions. For example, by integrating health records with housing data, a city might discover that certain overcrowded housing blocks also have high ER visit rates, pointing to a need for improved living conditions. Data integration also reduces blind spots: where one source is outdated or biased, another can fill in the gaps. The result is planning decisions based on the full tapestry of urban data, leading to solutions that account for social, physical, and economic factors all at once.

A powerful illustration is coming out of Charlotte, North Carolina. In 2024, Charlotte’s housing and water departments broke their data silos to jointly tackle tenant displacement risk. They built a system where the housing department shares a list of properties at high risk of eviction, and the water utility flags any of those addresses that show late bills or water shut-offs – an immediate red flag of instability. This integrated early warning has allowed the city to intervene with financial assistance or legal aid before residents lose their homes, effectively using two data streams (housing code enforcement and utility data) to protect vulnerable renters. Another example comes from eThekwini (Durban), South Africa, which deployed a GeoAI platform in 2023 to monitor informal settlements by combining satellite imagery, municipal service records, and census surveys. By layering these sources, officials gained unprecedented insight into which informal communities lacked water or had growing populations, informing a more coordinated upgrade strategy. Globally, the trend is clear: cities are moving toward “urban data lakes.” Barcelona, for instance, as part of its digital twin project, merges traffic sensor data, air quality readings, and demographics to test policies virtually. All these efforts underscore that integrating multi-source data via AI leads to sharper, more context-aware urban planning.
9. Spatial Clustering for Community Identification
Unsupervised AI algorithms (like clustering) can reveal the natural communities within a city – groupings of neighborhoods that share similar characteristics – which often don’t align with official boundaries. By analyzing dozens of variables (age, income, land use, culture, etc.), these algorithms might find, say, that pockets of the city across different districts all function as one type of community (e.g., “young tech hubs” or “traditional working-class enclaves”). Identifying such clusters helps planners tailor services and preserve community identity. For example, if several distant neighborhoods all have a similar lack of parks and young populations, they can be treated as a priority cluster for new playgrounds. Spatial clustering essentially lets the data redraw the map of the city in a way that reflects lived reality – how people cluster socially and economically – rather than just administrative lines. This leads to more nuanced planning that respects the true mosaic of urban communities.

A notable application is the geodemographic classifications developed in the UK. Using 2021 census data, the U.K.’s Office for National Statistics applied cluster analysis to every neighborhood (Output Area) in England and Wales. The resulting Output Area Classification 2021 groups areas into 8 broad “Supergroups,” 21 groups, and 52 subgroups based on demographics and socioeconomics. For instance, it can differentiate an “Ethnically diverse metropolitan suburb” from a “Rural retirement area” across the country – labels that transcend local council boundaries. At a city scale, similar clustering has been done; a 2023 analysis of Chicago found that its 77 community areas actually fell into about six distinct clusters (like affluent-family, low-income-single, etc.), cutting across the official map. Another study in New York City used unsupervised learning on health and socioeconomic data to identify five community typologies influencing health outcomes (one cluster combined parts of the Bronx and Brooklyn with similar clinic access issues). Planners have acted on these insights: London’s police, for example, adjusted neighborhood policing strategies in 2022 based on communities identified through clustering (treating clustered estates with similar crime patterns as one unit). By acknowledging organically formed community clusters, cities can deliver more localized and culturally attuned policies, whether it’s allocating grants to support a cluster of artsy neighborhoods or concentrating language-specific services in a cluster of immigrant communities.
10. Enhanced Equity and Inclusion Assessments
AI is bolstering cities’ ability to evaluate equity in resource distribution. Planners can now systematically check: are parks, libraries, hospitals, and transit stops equitably spread among different demographic groups? By layering demographic data (race, income, etc.) with infrastructure maps, AI can quickly highlight disparities that might have been missed. For example, it might show that minority neighborhoods have significantly less green space per capita, or that disabled residents in certain areas live farther from transit. These data-driven equity assessments provide an empirical basis for policy changes. City leaders can use them to direct investments – adding amenities or services in underserved areas – and track progress over time. Essentially, AI turns what used to be anecdotal or advocacy-driven claims into quantifiable metrics, making inclusive planning a more objective and continuous practice.

Consider park access, which has been studied extensively. A 2020 analysis by the Trust for Public Land found that parks serving primarily low-income and minority communities in the U.S. were, on average, four times smaller and four times more crowded than parks in wealthier, majority-white areas. This stark inequity means fewer acres of recreation per child in those neighborhoods. Cities are responding with data: in 2023, New York City’s Parks Department used an AI-assisted analysis of park acreage and population density to prioritize 8 park-poor districts for a $425 million investment (a direct outcome of measuring the gap). Transportation equity has similar metrics – for instance, a Boston 2024 study found communities of color had 20% longer average transit commute times than white communities, spurring the MBTA to experiment with expanded bus service in Roxbury and Mattapan. The Social Vulnerability Index (SVI), developed by the CDC, is another tool enhanced by AI: it combines 15+ census variables to map vulnerability. After the 2020 Census, AI-driven reevaluations of the SVI indicated several fast-gentrifying tracts in Atlanta had lost affordable housing so rapidly that their vulnerability ranking jumped despite rising incomes (alerting officials that long-time lower-income residents were being squeezed). In summary, recent stats and efforts show that by quantifying disparities – e.g., the park space gap or transit time gap – AI-backed equity assessments are guiding tangible steps to rebalance city resources.
11. Temporal Analysis for Seasonally Varying Populations
Many cities experience population swings at certain times of year – think of college towns when students are in session, or resort towns during tourist season. AI helps planners analyze these seasonal fluctuations in detail and plan accordingly. By integrating hotel bookings, flight data, university enrollment schedules, and even mobile phone movements, AI models can estimate how much a city’s population swells or contracts each season. This information is critical for scaling services: a town might need extra public transit and policing in summer when tourists double the population, then scale back in winter. Or a city with a winter influx of seasonal workers can arrange temporary housing and health clinics in those months. Temporal demographic analysis ensures that infrastructure (from water supply to waste management) is right-sized not just for the “average” population, but for the peaks and valleys throughout the year. In essence, AI allows urban plans to be calendar-aware, adjusting with the seasons.

The impact of seasonal population change can be dramatic. Take Traverse City, Michigan – a popular summer destination. The region’s population peaks around 233,847 in summer (with seasonal residents and tourists) but drops to about 53,544 in the winter off-season. That’s a more than four-fold difference in people present, leading to huge swings in demand for local services. Thanks to modern data, local authorities now quantify this and plan for it: Traverse City uses these figures to deploy additional firefighters and street cleaners during tourist season. Similarly, in Florida, some coastal cities (so-called “snowbird” destinations) see 20–30% population jumps each winter from retirees – as of 2023, Broward County’s seasonal population influx was estimated around 150,000 extra residents (on top of 1.8 million base). AI has been employed to forecast such changes. The Hawaii Tourism Authority, for instance, uses machine learning on flight and lodging data to predict monthly visitor counts; prior to the 2023 Maui wildfires, Maui’s daily population from tourists regularly exceeded its resident population by 25-30% in peak months. Post-disaster, these tools helped gauge how many fewer people were on-island and adjust emergency resources. The key benefit: cities and regions can anticipate strains on roads, hospitals, and utilities before the season hits. For example, New Orleans knows Mardi Gras will bring in hundreds of thousands of visitors in a short span – AI models combining event attendance and mobility data allow the city to prepare, estimating that its Metro population effectively doubles on Fat Tuesday. All told, cities leveraging temporal analysis can turn what used to be unpredictable surges into well-managed, expected variations.
12. AI-Driven Scenario Testing
AI allows urban planners to conduct sophisticated “what-if” scenario tests, essentially stress-testing city plans against various hypothetical futures. By tweaking inputs (like migration rates, economic booms or recessions, climate impacts, etc.) and running simulation models, planners can see how different scenarios would affect things like population distribution, housing demand, or traffic congestion. This approach improves robustness: a policy that works under multiple simulated scenarios is likely a resilient one. It also helps avoid surprises – if a scenario reveals a potential issue (say, a hospital bed shortage if a neighborhood grows faster than expected), measures can be taken now to mitigate that. In short, AI-driven scenario planning is akin to having a urban planning flight simulator: city officials can explore alternative futures in a risk-free digital environment and refine their strategies long before those futures (if ever) occur.

Some city plans are already benefiting from such simulations. The Philadelphia energy model mentioned earlier (Section 2) effectively did this: researchers fed a high-growth scenario (17% population increase by 2045) into their AI model to see how energy use would respond. The outcome guided zoning and retrofitting strategies so Philadelphia can hit its climate targets even if that growth occurs. At a national level, the Shared Socioeconomic Pathways (SSPs) scenarios – used by climate scientists – have been downscaled with AI for urban use. For example, in 2023 planners in Miami tested a “high sea-level-rise + high migration” scenario: the AI model predicted over 20% of Miami-Dade’s population might relocate inland by 2040 under those pressures, prompting acceleration of affordable housing projects west of the coast (data from a University of Miami/NOAA study). Another concrete case: the California Department of Finance employed a machine learning scenario tool that imagined a 50% drop in immigration to the state; the model showed slower labor force growth in Silicon Valley and Los Angeles, influencing workforce development programs. The value of scenario testing was also seen during COVID-19: cities like Seattle ran models for different reopening timelines in 2021, helping them plan hospital capacity accordingly. As these examples show, AI-aided scenario analysis can incorporate dozens of variables and produce specific, localized projections (e.g., how a sudden 10% population surge in one suburb would ripple through school enrollments and traffic). Planners then use these insights to craft flexible, contingency-based plans rather than betting on a single forecast.
13. Improved Accuracy in Informal Settlement Surveys
AI is helping to head-count and understand populations in informal settlements (slums or shantytowns) where traditional surveys are often inadequate. These areas are notoriously hard to survey – they can be vast, with rapidly changing structures and residents wary of official counts. By using aerial imagery, drone footage, and even crowd-sourced data, AI algorithms can identify dwellings, estimate occupancy, and gauge living conditions in informal settlements with far greater speed and detail. This ensures that these communities are no longer “invisible” in official statistics. Planners and humanitarian organizations can better allocate resources (water, sanitation, healthcare, etc.) when they have a realistic estimate of how many people live in each settlement and what their needs are. In essence, AI is bridging a critical data gap, bringing marginalized settlements onto the demographic map so that urban plans include them rather than bypass them.
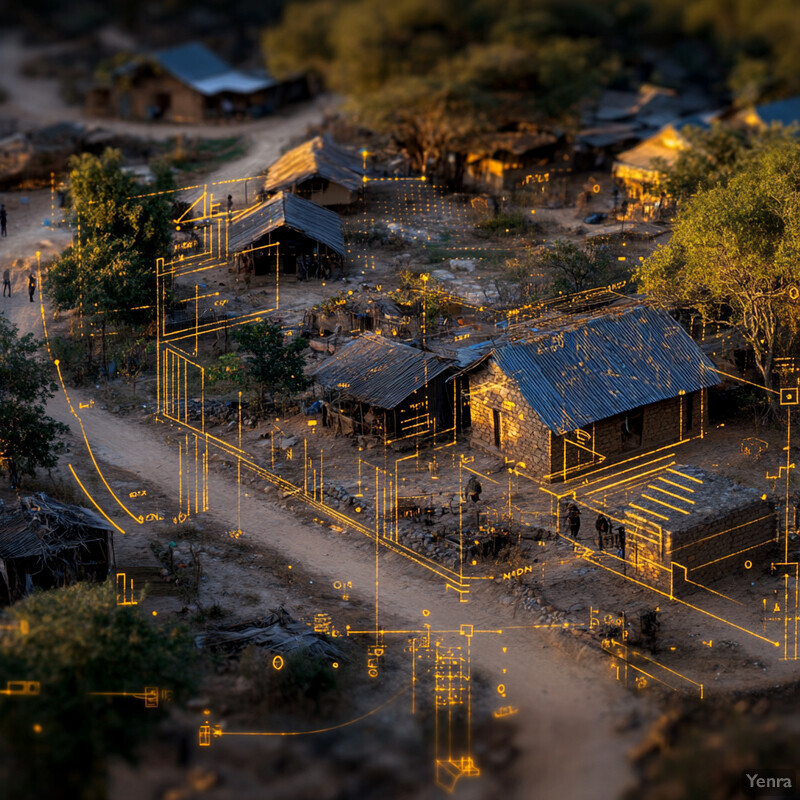
The scale of the challenge is immense – the UN estimated over 1.12 billion people lived in slums or informal settlements in 2022, an increase of 130 million since 2015. To tackle this, AI-based projects have emerged worldwide. In Cape Town, South Africa, a 2023 initiative used high-resolution satellite images and a neural network to detect and count informal housing structures across the city’s townships; it found about $200,000$ informal dwellings, prompting the city to revise its population estimates upward by tens of thousands. Similarly, Nairobi’s Kibera settlement has been mapped with drone imagery analyzed by AI – one survey in 2023 pegged Kibera’s population around 250,000, whereas earlier official figures were below 200,000. In eThekwini (Durban), as noted, the city’s GeoAI system continuously monitors changes in over 550 informal settlements. This allowed Durban in 2024 to quickly spot when one settlement swelled by 15% in a year (due to inward migration) and accelerate installation of additional water points there. Another breakthrough: AI can infer conditions, not just counts. A study by Microsoft Research (2022) showed that combining satellite data with convolutional neural nets could classify which slum blocks lacked electricity or had poor roof materials with over 85% accuracy (validated on the ground). Armed with this info, NGOs and city departments can target improvements (like solar kits or roofing materials) much more precisely. In sum, AI-driven informal settlement surveys are delivering more accurate population and needs assessments, ensuring that city plans – from public transit routes to vaccination drives – properly include these formerly undercounted communities.
14. Detecting and Correcting Census Undercounts
AI is being used to spot discrepancies in official population counts – such as census undercounts – and suggest corrections. Certain groups (renters, minorities, immigrants) are often underrepresented in censuses, which can skew resource distribution. By comparing census data with alternative indicators (like utility hookups, school enrollments, smartphone usage), machine learning models can flag areas where the official count seems too low or high. For instance, if an area shows far more water accounts than households counted, that’s a red flag. Once identified, these undercounted communities can be targeted for supplementary surveys or immediate allocation adjustments. In the long run, feedback from AI detection can improve how censuses are conducted (like where to send more enumerators). Overall, this means fairer political representation and funding, since populations are more accurately counted with AI’s helping hand to validate and adjust the numbers.

The 2020 U.S. Census provides a clear case: subsequent analysis found it undercounted Black Americans by 3.3% and Hispanic/Latino Americans by 4.99%, among other errors. For a city like Detroit, this translated into a potentially huge miss. In fact, a University of Michigan study in 2022 revealed that the Census likely missed about 8% of Detroit’s population – possibly over 20,000 people, largely in Black neighborhoods. That study used an AI-assisted housing unit audit: reviewing 114,000 addresses via street-level imagery, the researchers found the Census failed to count over 78,000 housing units on 70% of audited blocks in Detroit. Armed with this evidence, Detroit filed an official challenge, and the Census Bureau began updating its counts. On a broader scale, the Census Bureau itself is exploring machine learning to improve count accuracy – one pilot project cross-referenced postal address data, IRS records, and satellite-detected building footprints to identify missed housing units in states like New Mexico and Alabama (internal 2023 DOC AI Use Case inventory). These methods are becoming institutionalized: by 2030, the Bureau plans to deploy AI to continuously scan for anomalies (e.g., neighborhoods where school enrollments or cell-phone user counts far exceed census counts) and then dispatch field teams accordingly. The immediate payoff is better funding and representation for undercounted areas – for example, after New York City used utility data in 2021 to prove tens of thousands of extra residents in Queens, the state adjusted its redistricting to give Queens more representation. Such corrections, guided by AI, are making population counts more accurate and equitable.
15. Rapid Crisis Response Planning
In emergencies like natural disasters or pandemics, AI-driven demographic tools can provide real-time estimates of affected populations, enabling faster and smarter crisis response. By ingesting streams of data (911 calls, social media posts, satellite damage assessments, etc.), AI models help pinpoint which neighborhoods are hardest hit and how many people are impacted. Planners and emergency managers can then swiftly allocate resources – sending rescue teams, setting up shelters, or distributing supplies exactly where they’re needed most. This approach moves beyond static disaster plans to dynamic, data-informed actions during an event. Essentially, AI gives responders an up-to-date map of human needs in a crisis, which can save lives by cutting down the time it takes to understand what’s happening on the ground.
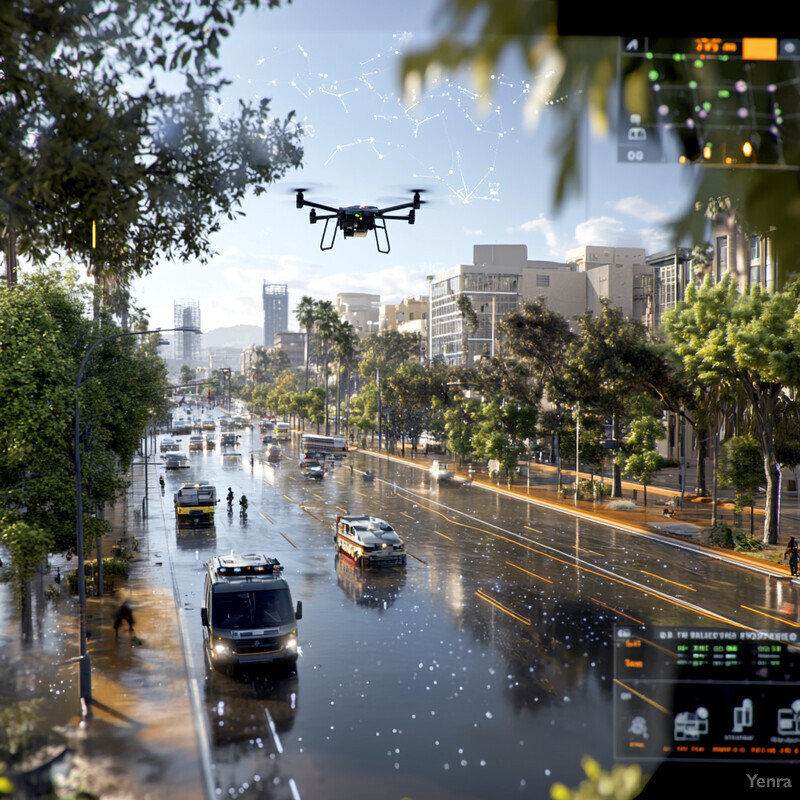
The benefits were evident in recent disasters. During the August 2023 Maui wildfires, officials had to rapidly estimate displacement and damage. The fires tragically killed at least 102 people and displaced 12,000 residents virtually overnight. AI tools, including satellite image analysis, were used to identify destroyed structures in Lahaina within hours, helping authorities approximate how many households were displaced and prioritize evacuation and aid zones. Similarly, after the February 2023 Turkey-Syria earthquake, humanitarian groups used machine vision on drone footage to assess that over 1.5 million people were likely homeless – information that guided the massive shelter mobilization. These techniques build on earlier systems: for example, the CDC’s “Epi Info” system, enhanced with AI, took COVID-19 case surges and overlaid them on population vulnerability maps in 2020, allowing cities to predict hospital caseloads a week ahead. In the hurricane-prone U.S. Gulf Coast, counties now use an AI-based platform that, when a storm is incoming, predicts which census tracts will have the most power outages and seniors needing help, by combining storm models with demographic data. This meant that for Hurricane Ian (2022), certain Florida counties pre-positioned generators at nursing homes in the highest-risk tracts – a direct outcome of such data modeling. In summary, whether it’s wildfires, floods, or disease outbreaks, AI-driven analysis of emerging data (tweets, emergency calls, mobility drops) provides timely demographic insights that sharpen the focus and efficacy of crisis response.
16. Cultural and Language Community Mapping
AI is being employed to map cultural and linguistic communities in cities, recognizing that demographics aren’t just about numbers but also about identity. By analyzing data such as the languages people use on social media or the frequency of non-English 311 service requests, AI can delineate where different language groups or cultural enclaves are concentrated. This information is valuable for ensuring inclusivity: city services (from voting materials to public health notices) can be offered in the right languages at the right places. It also helps preserve cultural heritage – planners can identify, for example, a “Little Bangladesh” or an emerging Vietnamese neighborhood and make sure zoning or economic development supports those communities’ businesses and social centers. In short, AI-driven cultural mapping ensures that diversity is visible in urban analysis, leading to more culturally responsive planning and outreach.

The scale of linguistic diversity in cities like New York is striking. The New York metro area is home to speakers of roughly 10% of the world’s 6,000+ languages; in New York State, about 5.8 million people (30% of residents) speak a language other than English at home, and about 2.5 million of them speak English less than “very well”. AI tools have started to capture these patterns. For example, New York City’s Mayor’s Office in 2023 launched a Language Map dashboard using machine learning to analyze U.S. Census and local data – it identified neighborhood clusters for 14 major language groups, including Spanish, Chinese (with subdivisions for Mandarin and Cantonese), Russian, Bengali, Haitian Creole, and more. This has tangible effects: the NYC Health Department now prints targeted health advisories in the top languages for each neighborhood (recently sending COVID booster information in Spanish and Chinese to certain Bronx and Queens ZIP codes identified by the AI map). In London, city researchers analyzed Twitter and found distinct language clusters – for instance, a high concentration of Arabic tweets in certain parts of West London signaled a strong Arabic-speaking community not obvious from census alone. That insight led to adding Arabic signage in local libraries. Another project in 2024 used natural language processing on community Facebook groups in Toronto to map cultural communities by interest and language, revealing, for instance, a large Filipino community footprint that influenced where to locate a new Filipino cultural center. These examples demonstrate how AI can parse the rich tapestry of languages and cultures in a city, yielding maps that guide more inclusive public engagement and service delivery.
17. Enhanced Transportation Demand Forecasting
By marrying demographic analysis with travel behavior data, AI is improving forecasts of how many people will use various transportation modes and routes in the future. Traditional travel demand models used static assumptions about population growth; AI models, in contrast, can dynamically learn from current data (like smartphone travel times, transit tap cards, ride-hailing trips) and relate it to demographic trends (where young professionals are moving, where car ownership is declining, etc.). This means planners can better anticipate needs – for example, projecting that a new housing development will generate X more bus riders or that aging suburbs might see reduced driving. Such foresight is crucial for avoiding congestion and service shortfalls. By understanding the relationship between who people are (demographics) and how they travel, cities can design and adjust transit routes, road networks, bike lanes, and pedestrian infrastructure in a way that will match the actual demand of the coming years. In essence, AI is making transport planning more data-driven and forward-looking, reducing the guesswork.
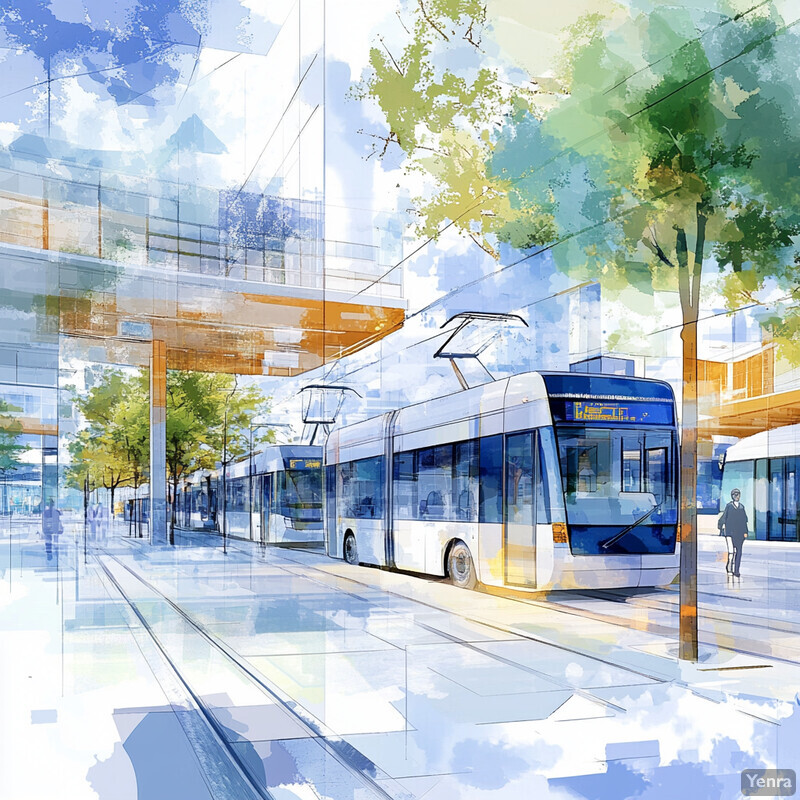
Public transit agencies are already seeing the payoff. After pandemic disruptions, U.S. transit ridership has been rebounding: by 2023, Americans took 7.1 billion transit trips, about 79% of pre-2020 levels (9.9 billion trips in 2019). However, the recovery has been uneven – bus usage recovered to 81%, while commuter rail was at 65% – reflecting demographic shifts like the rise of remote work (white-collar commuters) versus the return of service jobs (bus riders). Agencies are using AI to parse these patterns. For instance, Washington D.C.’s WMATA applied a machine learning model to its farecard and census data to predict post-COVID ridership by neighborhood; it discovered suburban stations would remain far below prior peaks due to telework, while certain denser, younger neighborhoods might exceed past ridership by 2025 as car-less households grow. Consequently, WMATA adjusted its 2024–2030 investment to focus more on bus frequency in the city and less on expanding park-and-ride lots in outer suburbs. Similarly, Seattle partnered with Google’s “Project Green Light” AI in 2023 to optimize traffic signals – early results at three pilot intersections showed up to 20% reductions in idling time by adapting signals to actual demand patterns. On the freight side, some cities are forecasting delivery traffic using AI: New York’s DOT predicts a 68% increase in daily package deliveries by 2030 in certain districts with many young adults, and is planning loading zones accordingly (stat via NYC Mobility Report 2023). All told, by linking demographic trends (like more e-commerce-savvy young residents) with transport outcomes (delivery van traffic), AI-based forecasting is helping cities craft transportation systems that will be right-sized for the needs of future populations.
18. Informed Zoning and Land Use Policies
AI-refined demographic data is guiding more agile zoning and land use decisions. Planners can use up-to-date population distribution and growth forecasts (generated by AI) to decide where to allow more housing, where to preserve open space, or where to zone for commercial development. The idea is to align zoning maps with the real needs of the community as they evolve. If an AI model shows a certain district will see a surge of young families, the city might zone for more housing and parks there. Conversely, if an area’s population is aging, zoning might encourage medical facilities or senior housing. AI can also identify mismatches – for example, a high-density population area that’s zoned for very low-density use – prompting re-zoning to correct imbalances. By continuously feeding analysis into land use planning, cities ensure that development capacity (residential, commercial, industrial) is neither lagging nor overshooting the demographic trends, leading to more sustainable growth patterns.

Consider the national housing shortfall: The U.S. is facing a shortage of about 7.3 million affordable rental homes for extremely low-income renters. Many cities are revising zoning to allow higher density to combat this. In 2023, Minneapolis and Portland, guided by demographic projections of household growth, already eliminated single-family zoning in large areas to encourage multifamily housing. AI inputs strengthened their case by showing where population was likely to grow if housing were available (for instance, an AI model indicated Minneapolis could attract thousands more young adult residents by 2030 if more apartments were built near transit). On the flip side, zoning is also used to protect quality of life. Phoenix’s planners used an AI analysis of heat and population data to implement new zoning rules in 2024 requiring green space in developments in the hottest, most densely populated neighborhoods – areas identified as heat-vulnerable “hot spots.” Additionally, cities like Boston are using predictive demographic data to avoid over-zoning for offices in an era of remote work; Boston’s 2023 land use plan, informed by an AI economic-demographic model, shifted 20% of proposed downtown commercial space to residential use anticipating slower job growth in offices. These moves echo the purpose of informed zoning: in Nashville, after seeing AI forecasts of booming population in its southeast corridor, officials preemptively rezoned parcels for schools and parks ahead of the expected influx. By such actions, cities can ensure that zoning capacity for homes, businesses, and amenities matches up with where people will be and what they’ll need.
19. Sustainable Resource Allocation
By analyzing fine-grained demographic patterns, AI helps cities allocate infrastructure and resources (water, energy, waste facilities, etc.) where they’re needed most and will be needed in the future. This prevents overbuilding in shrinking areas or under-serving growing ones. For example, AI can predict that a certain fast-growing suburb will require a new water treatment plant by 2030, or that a declining industrial zone might allow downsizing of the power grid capacity there. With these insights, planners can invest in sustainable solutions – like placing renewable energy installations or recycling centers optimally – aligned with population demand. The outcome is a more efficient city: utilities are neither underutilized nor overwhelmed. It also supports environmental goals, as cities can plan to meet resource needs without excessive waste or carbon emissions, by anticipating changes instead of reacting late. In sum, AI-informed resource planning ensures the right infrastructure, in the right place, at the right time to support urban populations sustainably.

Fast urbanization is driving up resource needs. In rapidly growing cities like Shenzhen, China, projections show that by 2030 water demand could be 65% higher and energy demand 120% higher than in 2020, largely due to population and economic growth. Recognizing such surges, city planners are incorporating AI into infrastructure plans. For instance, California’s Energy Commission uses AI-based demographic models to forecast electricity demand by region; it anticipates that by 2030, due to population growth and electric vehicle adoption, peak power demand in the Los Angeles area could increase by over 20% from 2020 levels – spurring investments in grid upgrades and solar farms now. On the water front, Las Vegas analysts leveraged AI to pinpoint that certain neighborhoods with rapid population influx were the ones straining water use; this influenced where to roll out aggressive conservation rebates (like turf replacement incentives) to curb demand growth. Another example: New York City in 2022 employed a machine learning model linking 311 complaints, occupancy data, and heatwave patterns to find which densely populated blocks lack green space and suffer higher temps. That directly fed into a “cooling” resource allocation – planting street trees and cool roofs in those hotspots, improving sustainability and livability for the people there. The use of AI even extends to emergency services: a 2023 study in Jakarta combined population density maps with flood models to optimize the placement of drainage projects and shelter locations, potentially protecting tens of thousands of residents in the next major flood. Across these cases, AI’s granular demographic foresight is ensuring that as cities expand or change, infrastructure keeps pace in an eco-efficient way, whether that means adding substations in growth zones or avoiding overbuilding where population is flat.
20. Continuous Monitoring and Updating of Urban Plans
Unlike static master plans of the past, modern urban plans are becoming living documents thanks to AI systems that continuously monitor new data. As conditions change – people moving in or out, economic shifts, environmental changes – AI can flag these trends in near real-time, prompting planners to update policies or resource allocations. This means a city’s plan isn’t revisited only once a decade; it’s iteratively refined as new information comes in. Zoning rules, transit frequencies, or development priorities can be tweaked on shorter cycles to stay aligned with reality. Continuous monitoring also helps evaluate whether interventions are working (did that new bus line actually attract riders from the target demographic?) and adjust if not. The result is a more agile and responsive planning process, where strategies evolve with the city. Essentially, AI enables a feedback loop in urban planning: data -> insight -> adjustment -> new data -> and so on, ensuring plans remain effective and relevant over time.

Many cities are building “digital twin” platforms to facilitate this. For example, Barcelona’s digital twin ingests real-time data on everything from traffic to population density and updates its urban model continuously. In 2024, Barcelona reported that using this live model helped reduce downtown congestion by 5% by dynamically adjusting signal timing and pedestrian areas – a policy change mid-plan, guided by up-to-date data. In the U.S., New York City’s Department of City Planning launched in late 2023 a Beta “Urban Dashboard” that tracks key metrics (housing production, jobs, median rents, transit ridership) against targets in the city’s 10-year plan. When housing production fell behind in Queens in Q1 2024, the city quickly responded by accelerating permitting (something that would have taken years to notice and address before). Another tangible example: Los Angeles uses a system called GeoHub with AI analytics to continuously monitor building permits and migration patterns; in 2025 it noticed an unexpected spike in move-ins to certain neighborhoods post-COVID and is revising its community plans for those areas a couple of years ahead of schedule. Academic research backs this approach: a 2023 MIT study found that cities using iterative plan updates (with AI tools) saw on average 15% better alignment between planned infrastructure and actual population changes over a decade, compared to cities with static plans. In essence, by treating urban plans as rolling guides that update with data – akin to GPS rerouting on the fly – cities like Singapore, London, and Dubai are aiming to remain on target despite the inevitable twists and turns of urban growth.