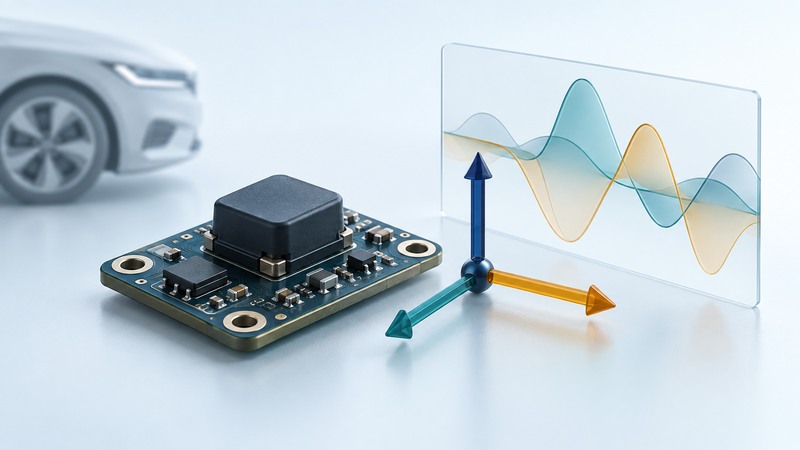
An accelerometer reports a measurement along one or more defined axes. To interpret it, you need the axis directions, units and processing as well as the number. In a vehicle, acceleration readings can contribute to a larger motion estimate, but a single value does not explain the entire maneuver or certify a safety system.
Understand what the sensor reports
An accelerometer responds to specific force: the non-gravitational force per unit mass acting on its sensing element. In practical sensor descriptions this includes a gravity-related reading when the sensor is supported at rest. An ideal stationary sensor can therefore show about 1 g along a suitable vertical axis even though its position is unchanged. The sign depends on the defined axis convention.
The Analog Devices ADXL345 documentation gives a concrete component example of static gravity sensing and dynamic motion/shock measurement. Its ranges and interfaces belong to that component. An educational sensor board, a phone and an automotive-qualified module have different application requirements.
Acceleration is usually reported in metres per second squared or multiples of g. Here, 1 g uses the standard reference 9.80665 m/s²; a milligravity unit, mg, is one thousandth of g. Speed, acceleration and angular rate are distinct quantities. Keep their units attached when copying readings into a worksheet.
Establish the coordinate system first
On a narrow screen, scroll the table horizontally. Keyboard users can focus its region and use the arrow keys.
| Field | What to record | What it prevents |
|---|---|---|
| Axes | Positive directions and mounting orientation | Mistaking sideways motion for forward motion |
| Units and scale | g or m/s², conversion and measurement range | Incorrect magnitude or unnoticed clipping |
| Gravity handling | Raw specific force or a processed gravity-removed estimate | Interpreting a stationary gravity response as road acceleration |
| Time | Timestamps, sampling interval and missing records | Comparing events on incompatible time scales |
| Processing | Filtering, calibration and coordinate transforms | Treating processed output as an untouched measurement |
The sensor axes may point differently from the vehicle’s forward, lateral and vertical directions. A software display may transform them again. Find the documentation for the reported fields before assigning a physical meaning to a plot. Record whether the sensor was fixed securely or could move independently of the vehicle.
A reading at the sensor location also reflects its local motion and vibration. Do not assume a phone in a cup holder represents a calibrated measurement at the vehicle’s center. Describe the mounting and the question the data can reasonably answer.
Separate tilt assumptions from vehicle motion
Analog Devices’ inclination-sensing application note explains how a gravity projection can be used to infer tilt when its assumptions hold. Sustained vehicle acceleration can corrupt a tilt estimate built on gravity alone. Filtering can suppress some changing components, but it cannot make every constant acceleration distinguishable from tilt.
As a separate units example, 0.20 g × 9.80665 m/s² per g = 1.96133 m/s², about 1.96 m/s². That conversion changes the units; it does not remove gravity or prove where the acceleration came from. Keep the hypothetical example separate from actual logged data.
See how a vehicle combines measurements
A gyroscope measures angular rate, while accelerometers supply specific-force measurements. Other information, such as wheel speeds or satellite positioning, may help a system interpret motion. Combining measurements with a model is often called sensor fusion; its quality depends on the sensors, calibration, timing and algorithm.
The Bosch automotive inertial-measurement-unit explanation describes acceleration along three axes alongside yaw, pitch and roll rates, with applications in vehicle control and localization. This is an example of a system component, not a specification for every car. A sensor’s role in a safety function cannot be inferred from an unrelated development-board demonstration.
Follow the vehicle’s service information when a warning indicates a fault. Do not probe, disconnect or deliberately trigger restraint-system sensors as an experiment. A phone trace cannot validate airbag deployment logic, and no generic acceleration threshold here authorizes such a test.
Make a claim that the data can support
For an existing log, check the source, mounting, axes, time base and processing first. Look for missing samples, repeated timestamps and readings pinned at the range limit. Preserve the original file before converting units or smoothing a plot so that another person can reproduce your interpretation.
Write the conclusion with its limits: for example, a particular processed channel changed during a recorded event, with orientation still unverified. If those uncertainties prevent the desired conclusion, identify the missing documentation or suitable reference measurement. Better labels are often more valuable than a more dramatic graph.
Save a practical worksheet
Download the automotive accelerometers worksheet (plain text). Open it in any text editor, save a private copy, and fill in the prompts while you work. It includes the article link and supporting references. Record “unknown” when a question still needs evidence.