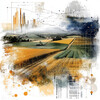
Accurate Yield Estimation at Various Scales 3 - Image Index | 20 Ways AI is Advancing Satellite Data Analysis for Agriculture Accurate Yield Estimation at Various Scales: An aerial view of a vast landscape, characterized by numerous fields and trees. The top half of the image is dominated by a graph or chart with multiple bars and lines, suggesting a data visualization related to agriculture or farming. This could represent the yield estimation at various scales, as indicated in the title. The bottom half of the image features a series of lines and symbols that appear to be a map or diagram, possibly illustrating the layout of the fields or the location of specific crops. The overall impression is one of a futuristic and high-tech approach to agricultural management, potentially involving advanced data analysis and visualization techniques.