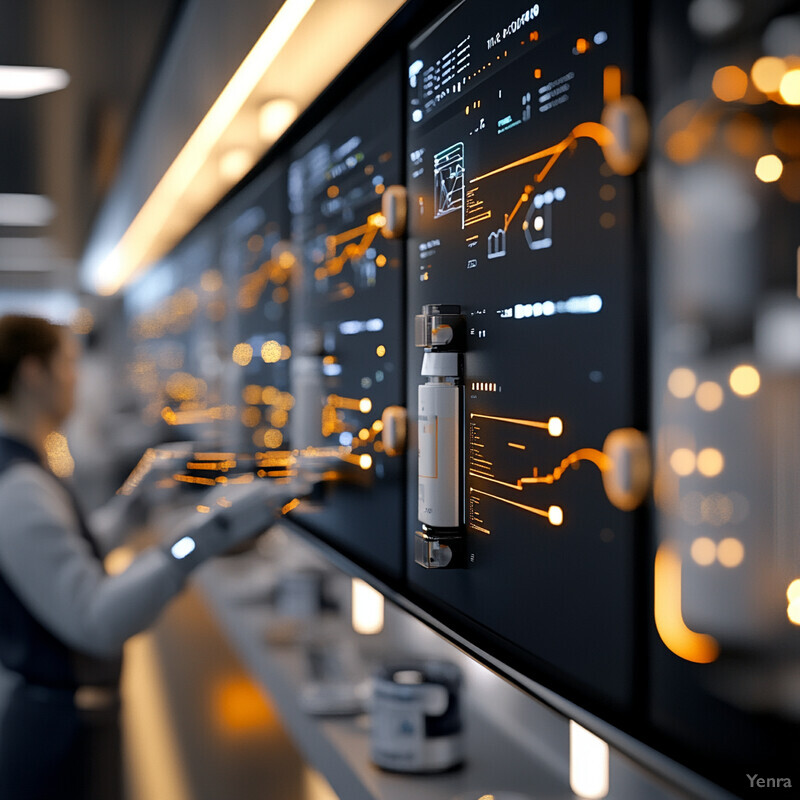
Adaptive Workflow Optimization 0 - Image Index | 20 Ways AI is Advancing Robotic Pharmacy Dispensing Data Analysis and Performance Monitoring: A large screen displaying various graphs and charts, with a person standing in front of it, likely interacting with the data. The screen is divided into multiple sections, each showing different types of information such as line graphs, bar charts, and scatter plots. The data appears to be related to business or financial performance, with metrics like revenue, profit margin, and customer satisfaction being tracked over time. The person in front of the screen is wearing a vest and has their back turned to the camera, suggesting they are focused on analyzing the data. Overall, the image conveys a sense of professionalism and attention to detail, implying that the company or organization is serious about monitoring its performance and making informed decisions based on data-driven insights.