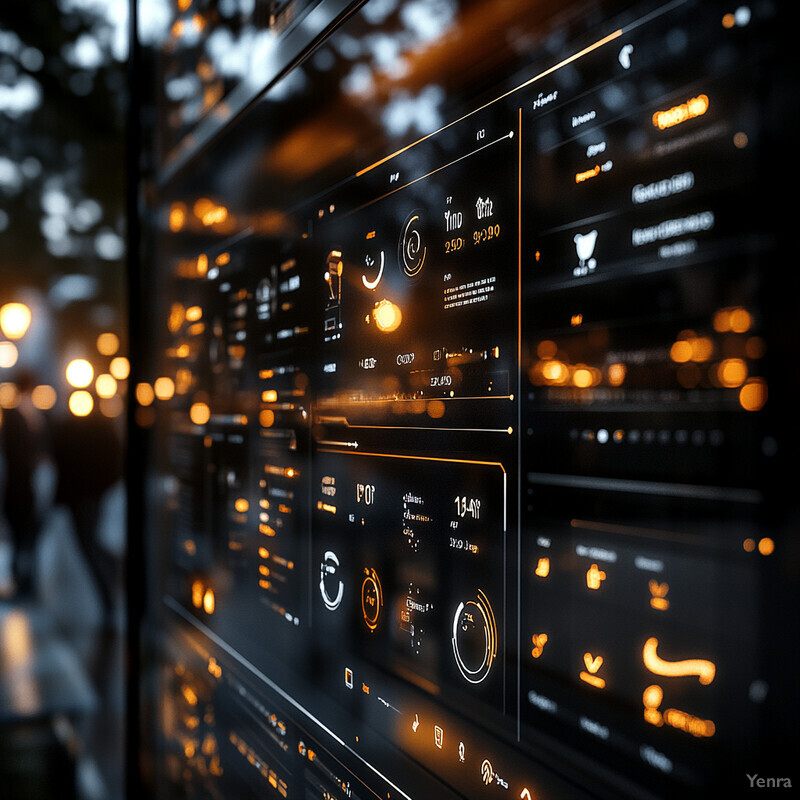
Consumer Sentiment Integration 1 - Image Index | 20 Ways AI is Advancing Retail Shelf Layout Optimization Data Analysis at an International Conference: A wall covered in various screens displaying different information and data. The screens are arranged in a grid-like pattern, with each screen showing a unique display of text and graphics. Some screens appear to be displaying charts or graphs, while others seem to show more abstract or artistic representations of data. The screens themselves are black in color, which provides a stark contrast to the orange-colored text and graphics that they display. In some cases, the text on the screens appears to be written in multiple languages, suggesting that this image may have been taken at an international conference or event. Overall, the image suggests a high-tech environment where data is being analyzed and presented in a visually engaging way.