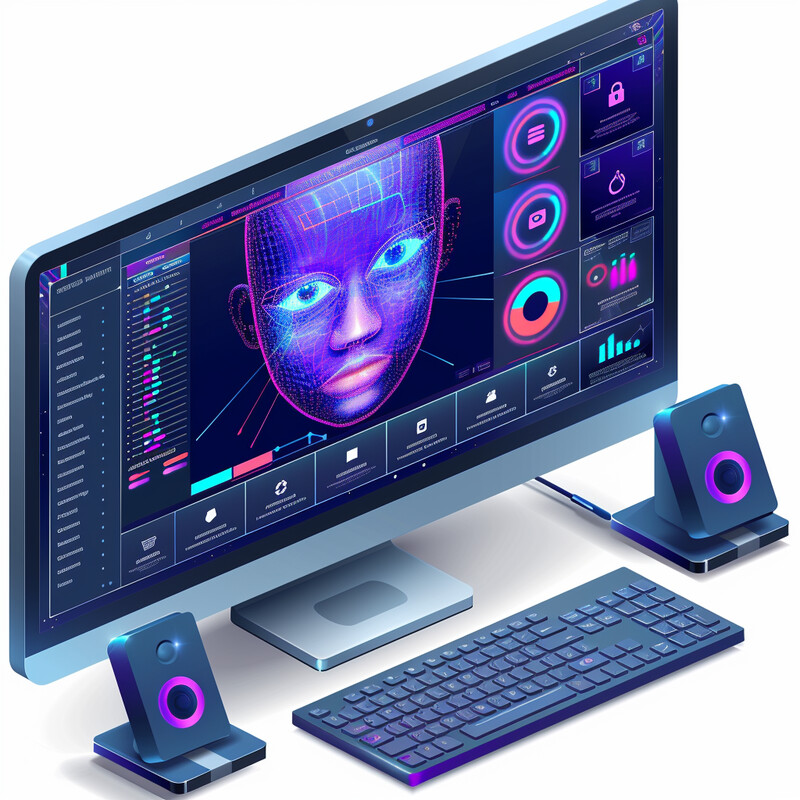
Fraud Detection and Prevention 0 - Image Index | 10 Ways AI is Improving Online Auction Platforms Analyzing Data on a Computer Monitor: A computer monitor displaying a futuristic-looking interface with various charts and graphs. The screen is divided into several sections, each containing different types of data. On the left side of the screen, there are two columns of text that appear to be labels for the charts and graphs on the right side. In the center of the screen, there is a large graphic that resembles a pie chart or donut chart, but it's difficult to tell exactly what it represents without more context. To the right of this graphic, there are several smaller graphics that seem to be related to each other in some way. They all have similar shapes and colors, suggesting that they might be displaying different aspects of the same data set. Overall, the image suggests that the user is analyzing or comparing various pieces of information, possibly as part of a business or financial decision-making process.