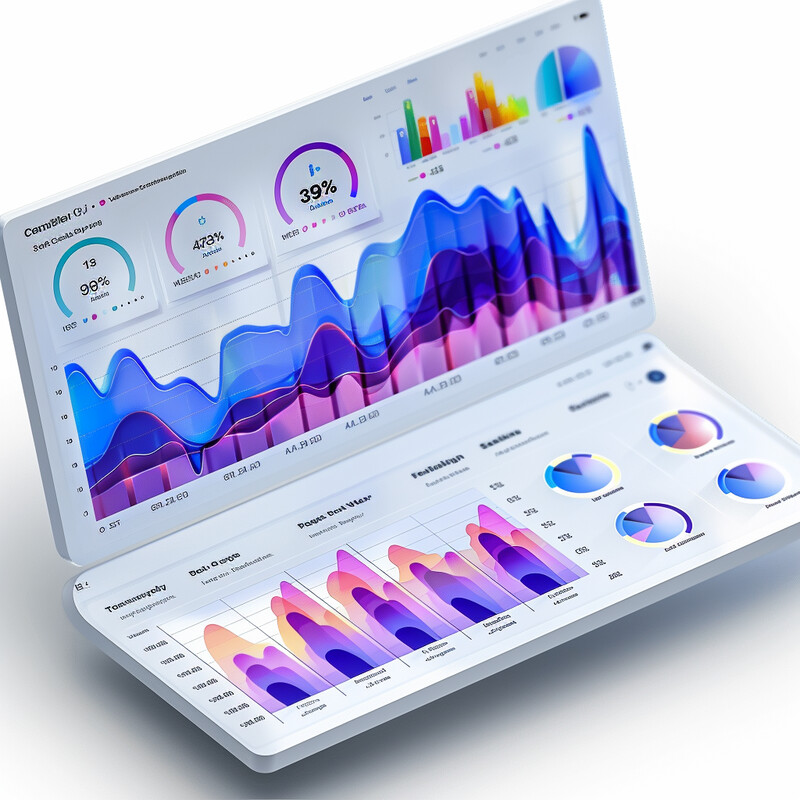
Consumer Feedback Analysis 1 - Image Index | 10 Ways AI is Improving Food Safety and Inspection Graph Analysis on Laptop Screen: The provided image shows an open laptop displaying a graph with various data points and statistics. The graph appears to be a line chart, with multiple lines representing different variables or metrics. Each line has distinct colors, making it easier to distinguish between them. The x-axis is labeled with dates, while the y-axis represents numerical values. There are also several indicators, including a percentage sign and an arrow pointing upward. Additionally, there are four pie charts in the bottom right corner of the screen, which seem to represent different categories or segments. Overall, the image suggests that the graph is being used for data analysis and visualization, possibly for tracking trends or monitoring performance over time.