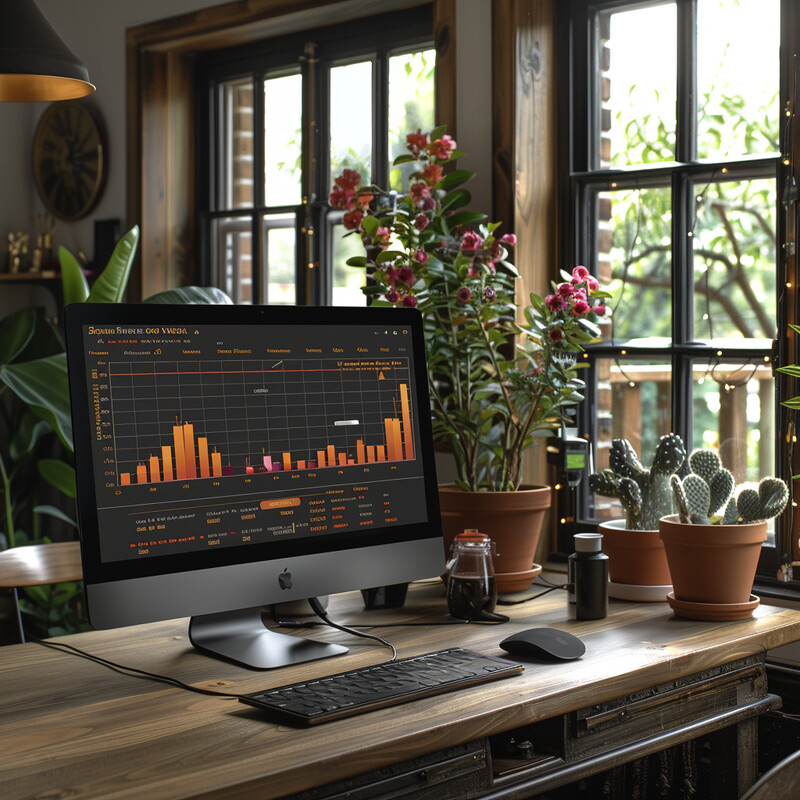
Energy Demand Forecasting 0 - Image Index | 10 Ways AI is Improving Energy Consumption Optimization Energy Demand Forecasting Graph in Office Setting: An office setting with a computer monitor positioned on top of a wooden desk in front of windows, showcasing a graph displaying energy demand data. The computer screen displays a bar chart with orange bars and a black background, featuring a grid pattern with numbers ranging from 0 to 64 along the x-axis and corresponding numerical values along the y-axis. The graph's title is not visible; however, it appears that the chart represents the total amount of energy demanded at various times throughout the day. A white text box in the middle of the graph contains a value but lacks accompanying labels or text. The computer monitor rests on top of a wooden desk with drawers, accompanied by a keyboard and mouse. The background features two large windows flanked by wooden frames, allowing natural light to illuminate the room. Beyond the windows lies an outdoor area filled with greenery and trees. A black lampshade hangs from the ceiling above the desk. Overall, this image suggests that it is used for educational purposes in an office setting.